What is an AI dashboard?
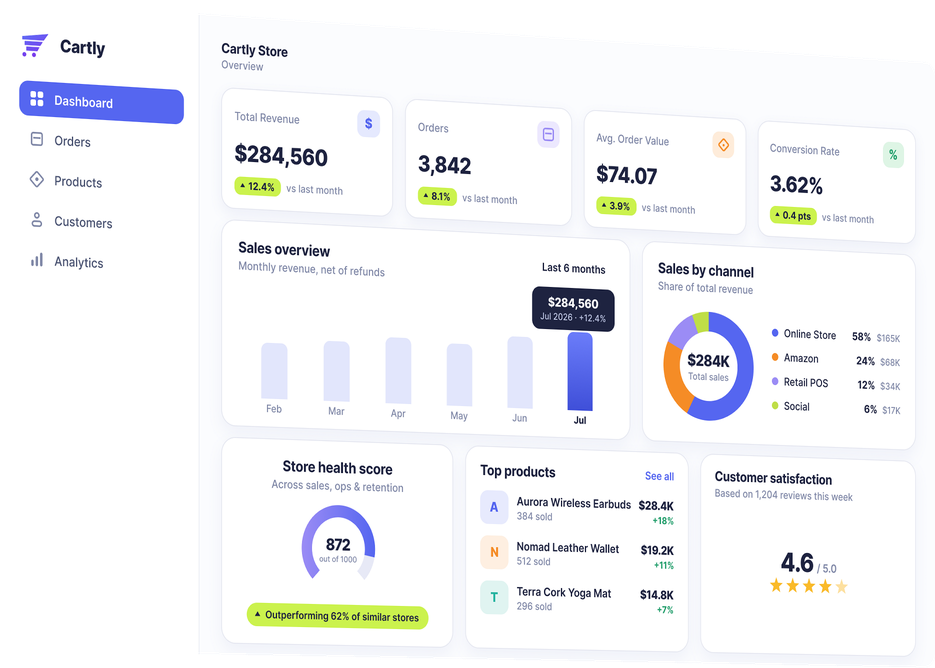
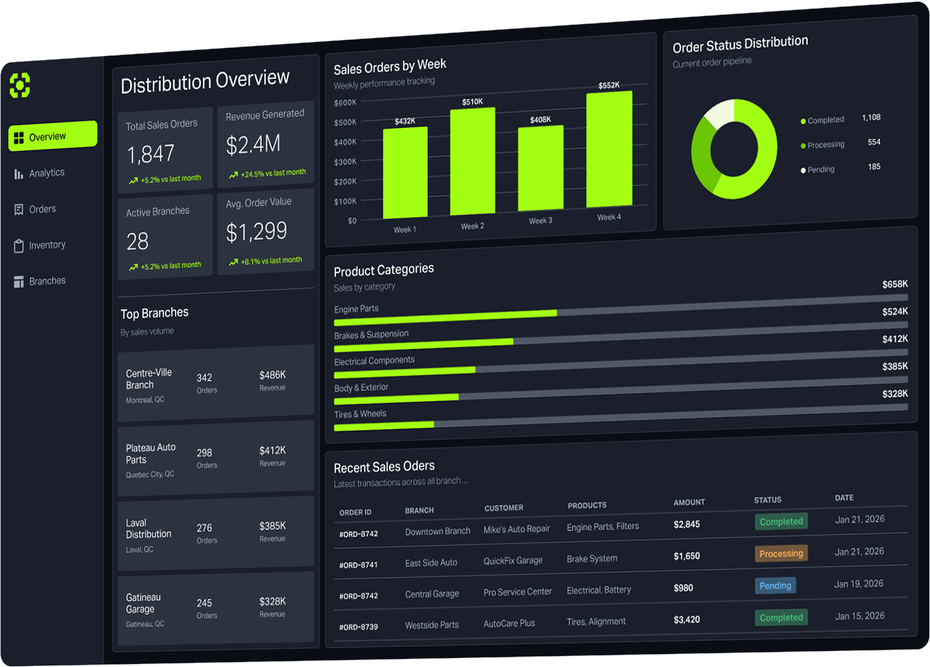
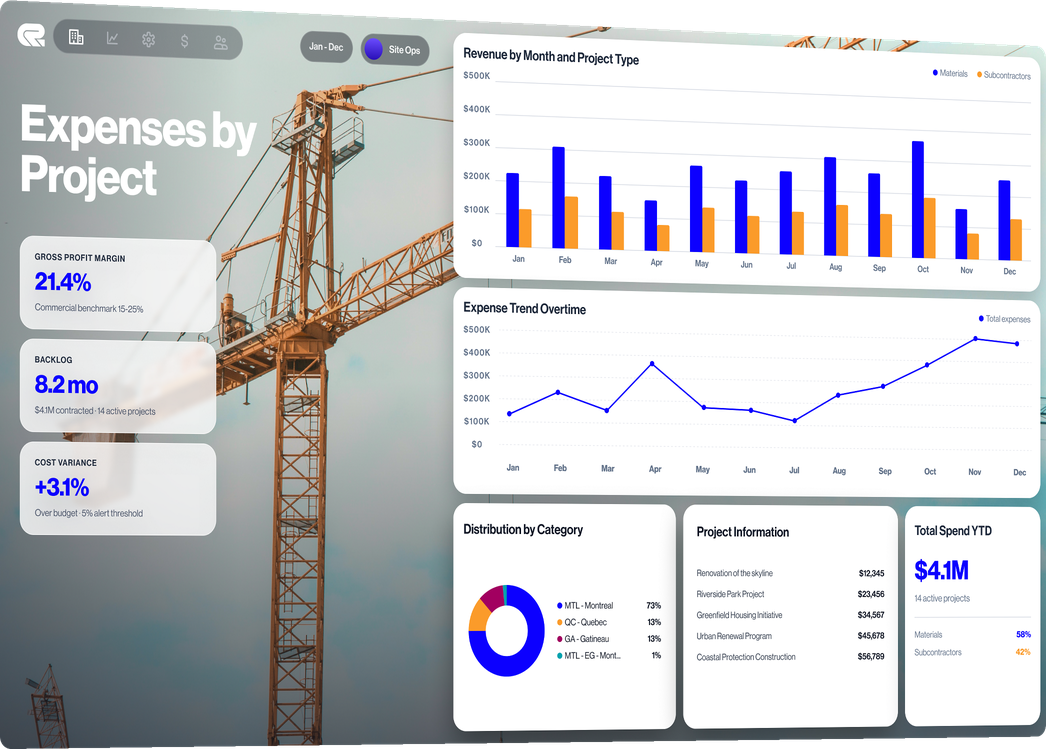
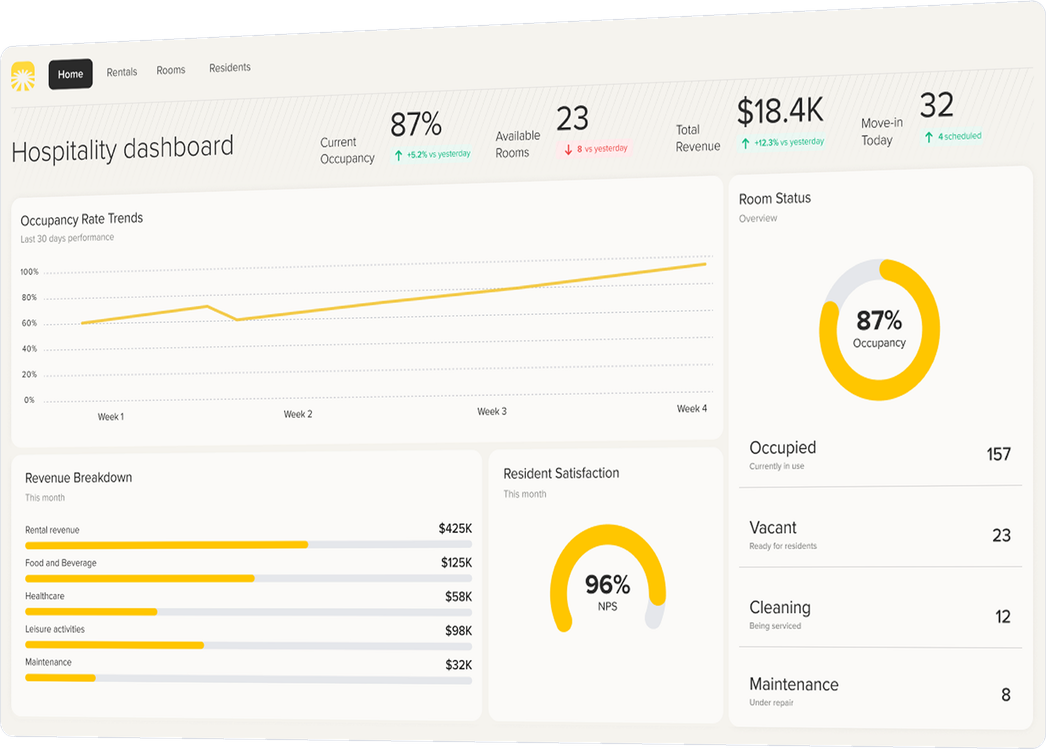
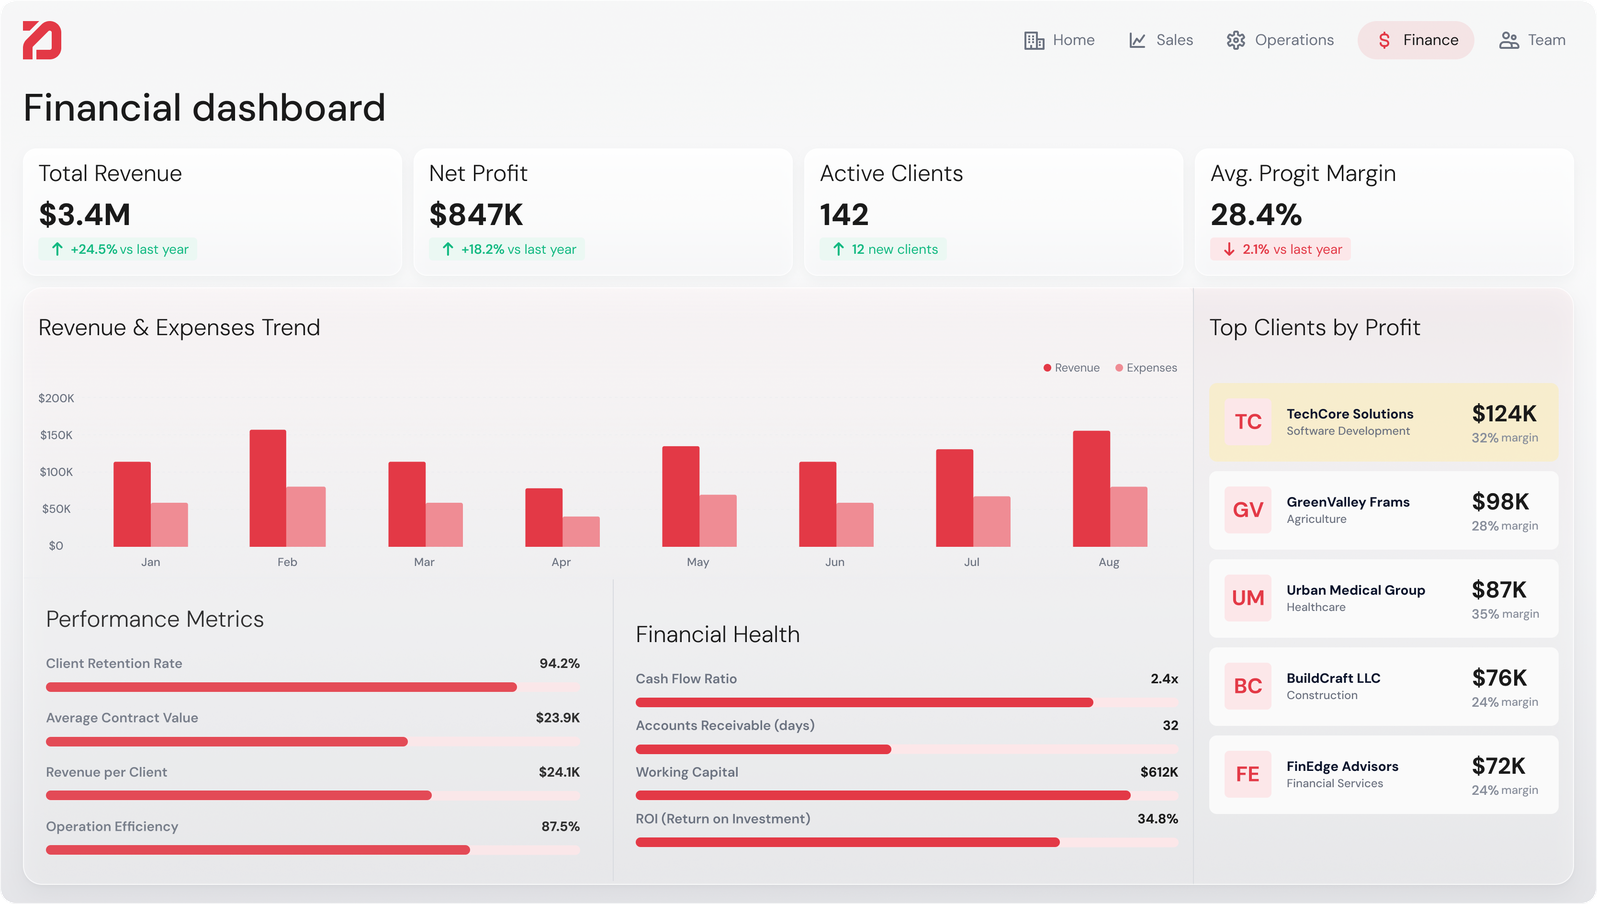
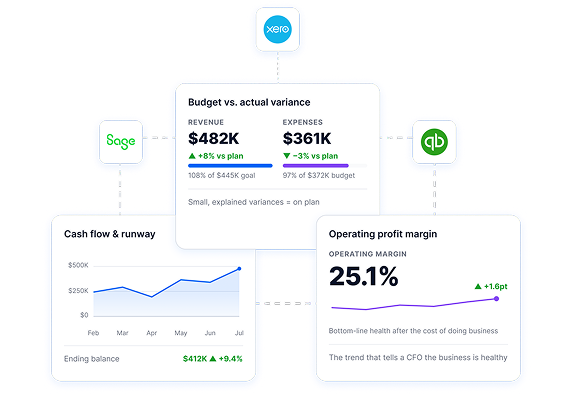
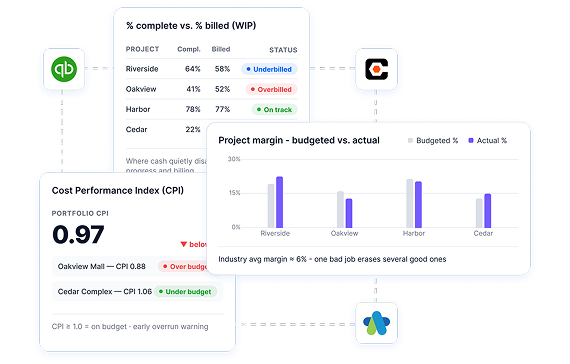
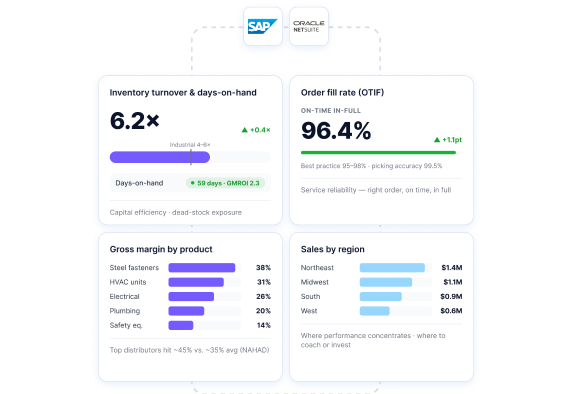
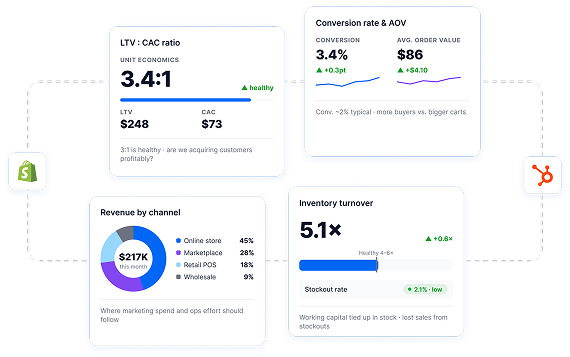
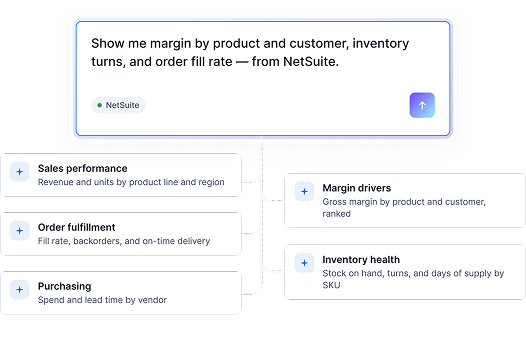
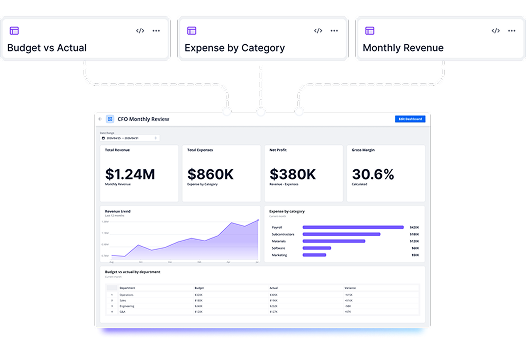
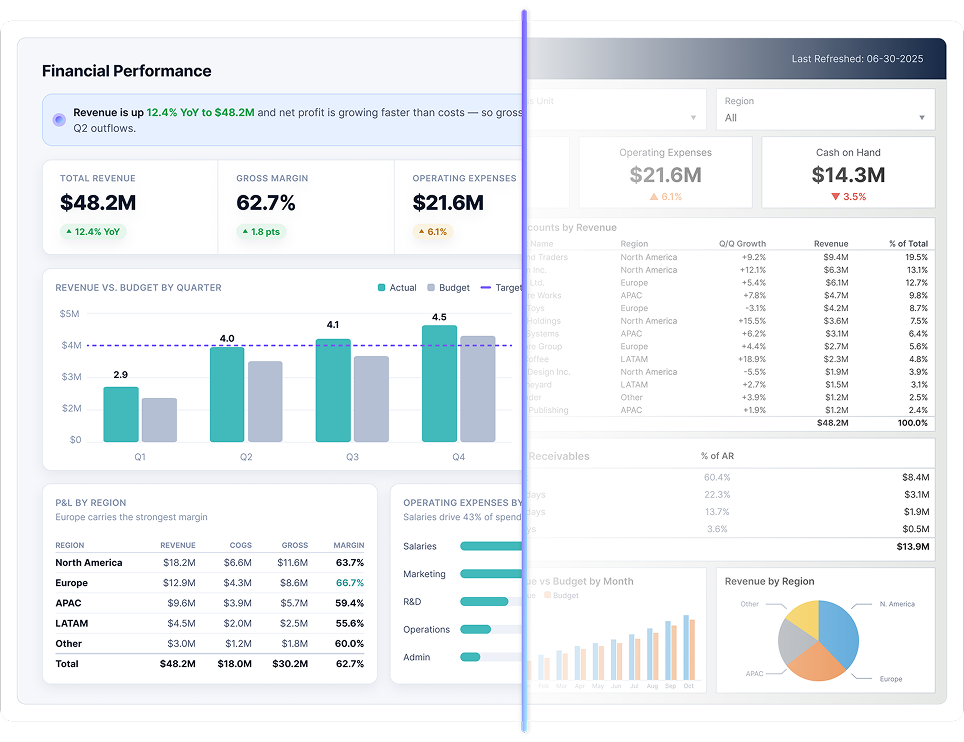
An AI dashboard is one you describe in plain language instead of assembling by hand. You write what you want to see, and BEEM returns a fully rendered dashboard of charts, KPI metrics, and tables, each one wired to a live query against your own datasets. From there you can click into any value to open the rows behind it, or describe a change in the side panel and have the dashboard updated for you.
How does an AI dashboard work?
Your description is turned into a plan for the page, then into the individual cards, and then into the query that sits behind each card, with a review pass before anything is shown. Cards appear one at a time as each query resolves, so the dashboard fills in progressively rather than making you wait for the whole page. All of it runs on AWS Bedrock inside your own cloud environment, and every generation, edit, and publish is kept as a version you can review or roll back to.
Can BEEM build a dashboard automatically from my data?
Yes. You can either describe the dashboard you want or pick one of the suggestions BEEM generates for your workspace, and either way the result is built on your real connected data rather than on sample content. You can also attach reference files, such as an image, a PDF, or a spreadsheet, to steer the look or supply a spec, and you can choose a brand theme and a visual style or let BEEM select them.
Do I need to know SQL or a BI tool?
No. AI Dashboards are built from a written description, and AI Insights answers questions about your data in plain language. SQL is available in the Warehouse for the people who want it, but nothing on the dashboard side depends on it.
Do I need a data warehouse to build dashboards?
No, because one is included. BEEM runs a built-in warehouse on Amazon Redshift, so your connected sources land somewhere queryable without you buying, sizing, or maintaining separate storage. Transformations run there on the schedule you set, which is what keeps the dashboards sitting on top of them consistent.
What's the difference between BEEM and Power BI directly?
Power BI sits at the top of the stack and draws the charts; it still expects the connectors, the storage, and the modelled data to be handled somewhere else. BEEM covers that lower half, with 750+ connectors, a built-in Redshift warehouse, and a SQL transformation layer, and then adds AI Dashboards of its own, generated from a plain-language description. The two are not mutually exclusive, so if your team is committed to Power BI, BEEM can feed it clean, modelled data instead of replacing it.
Can BEEM rebuild the Power BI reports we already run?
Yes. Attach an export or a screenshot of a report you run today and BEEM uses it as the spec, rebuilding that view as an AI Dashboard on your connected data. The migration starts from what your team already reads rather than from a blank page, and once the connections are live the next dashboard comes from a description instead of a ticket. Book a demo and we will walk through what moving would look like for your reports.
Why can't I connect my software directly to Power BI?
For one system and a small report you often can, but it stops scaling quickly, because each business system exposes its data differently, nothing joins across them, and every refresh goes back to the source application. Combining an ERP, a CRM, and an accounting system means landing them all in one place and modelling them first. That is the work BEEM does underneath: ingesting each source into the Datalake, transforming it in the Warehouse on a schedule, and handing a clean dataset to whatever draws the chart.
Do viewers need a paid license?
No. Access is governed by the role you assign inside the workspace, so someone given the Viewer role gets read-only access to dashboards, datasets, and AI Insights without any edit rights. BEEM is priced as a plan for the organization rather than by the number of people reading a dashboard.
Where does my data live?
In your own dedicated AWS environment, hosted in the Canadian ca-central-1 region rather than pooled with other customers. The AI features run on AWS Bedrock inside that same environment, so your data is not sent somewhere else to be analysed. BEEM is SOC 2, PIPEDA, and GDPR compliant, and Monitor keeps a complete audit trail of every event in the workspace.
How fast can we have our first dashboards?
Most teams have their first dashboards in as little as two weeks: the connections go in during the first week, and there are numbers to review in the second. Once the connections are live, generating a dashboard from a description is something you do in the app rather than a project you schedule. If you would rather see it before committing, the proof of concept program is built around that same two-week window.