
A wrong number never announces itself. It travels, it lands in a report, it gets presented in a meeting, and eventually someone notices that last month's figure has changed with no explanation. At that point the problem has stopped being technical. Trust in the numbers has taken the hit, and trust comes back far more slowly than it disappears.
The point of data quality management is to prevent that situation in an organized way, instead of fixing errors one at a time as they surface. The seven steps below apply to a mid-market company, with or without a dedicated data team.
What data quality management covers
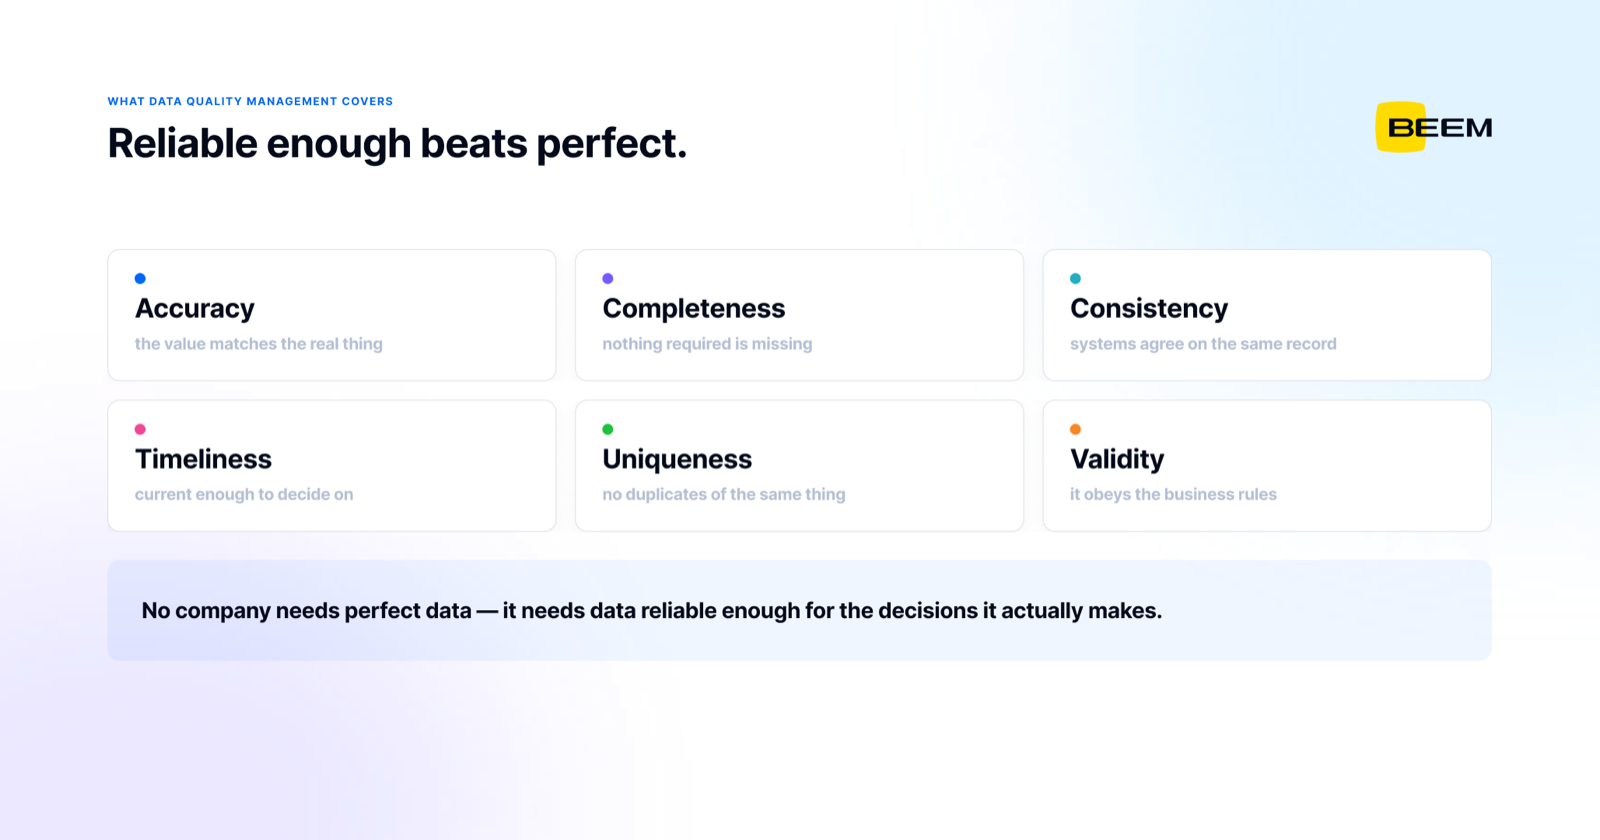
It is the set of rules, checks and responsibilities that keep the data used for decisions aligned with the reality it describes. Industry frameworks converge on six dimensions: data accuracy, completeness, consistency across systems, timeliness, uniqueness (the absence of duplicates), and validity against business rules.
One clarification before going further. This is not a one-time cleanup project. A database scrubbed in January drifts back into approximation by June if nothing stops errors from getting in. The work has a technical side and an organizational side, and the second one is where most programs quietly fail.
A last piece of framing: no company needs perfect data. It needs data reliable enough for the decisions it actually makes. Confusing the two produces months of work on fields nobody opens.
Why quality degrades even with good tools
According to Gartner, poor data quality costs organizations an average of $12.9 million a year, and inconsistency between sources ranks as the hardest data quality problem to solve. The figure is an estimate drawn from their research with large enterprises, but the order of magnitude says enough about what is at stake.
Degradation rarely comes from carelessness. It comes from how tools pile up. Every new application arrives with its own entry rules, its own identifiers and its own definition of an active customer or an open project. Nobody is tasked with arbitrating between those definitions, so they coexist. Manual entry does the rest, with typos, blank fields and values invented to get a form to save.
The effects show up first in operations: the same information re-entered in two systems, reports that disagree from one department to the next, close cycles stretched by manual verification. They show up next in decisions, when a forecast rests on an incomplete history and nobody knows it at the moment it is presented.
Time does the rest. Contact details change as people move roles, product catalogs get restructured, entities merge and legal names change. A record that was accurate at entry becomes wrong without anyone touching it, which is why a quality program built as a single cleanup always looks successful for about two quarters.
A documented client case in construction shows what the pile-up looks like. The company combined an on-premise ERP, a cloud project management platform, HR tools and a CRM. Data arrived duplicated, inconsistent and unstandardized, to the point that the team spent hours cleaning Excel files by hand before moving them into Power BI. Leadership had no dependable view of project costs or margins. Once the data was standardized and the flows automated, duplicates and inconsistencies were eliminated and manual cleanup left the team's daily routine.
Seven steps to reliable data
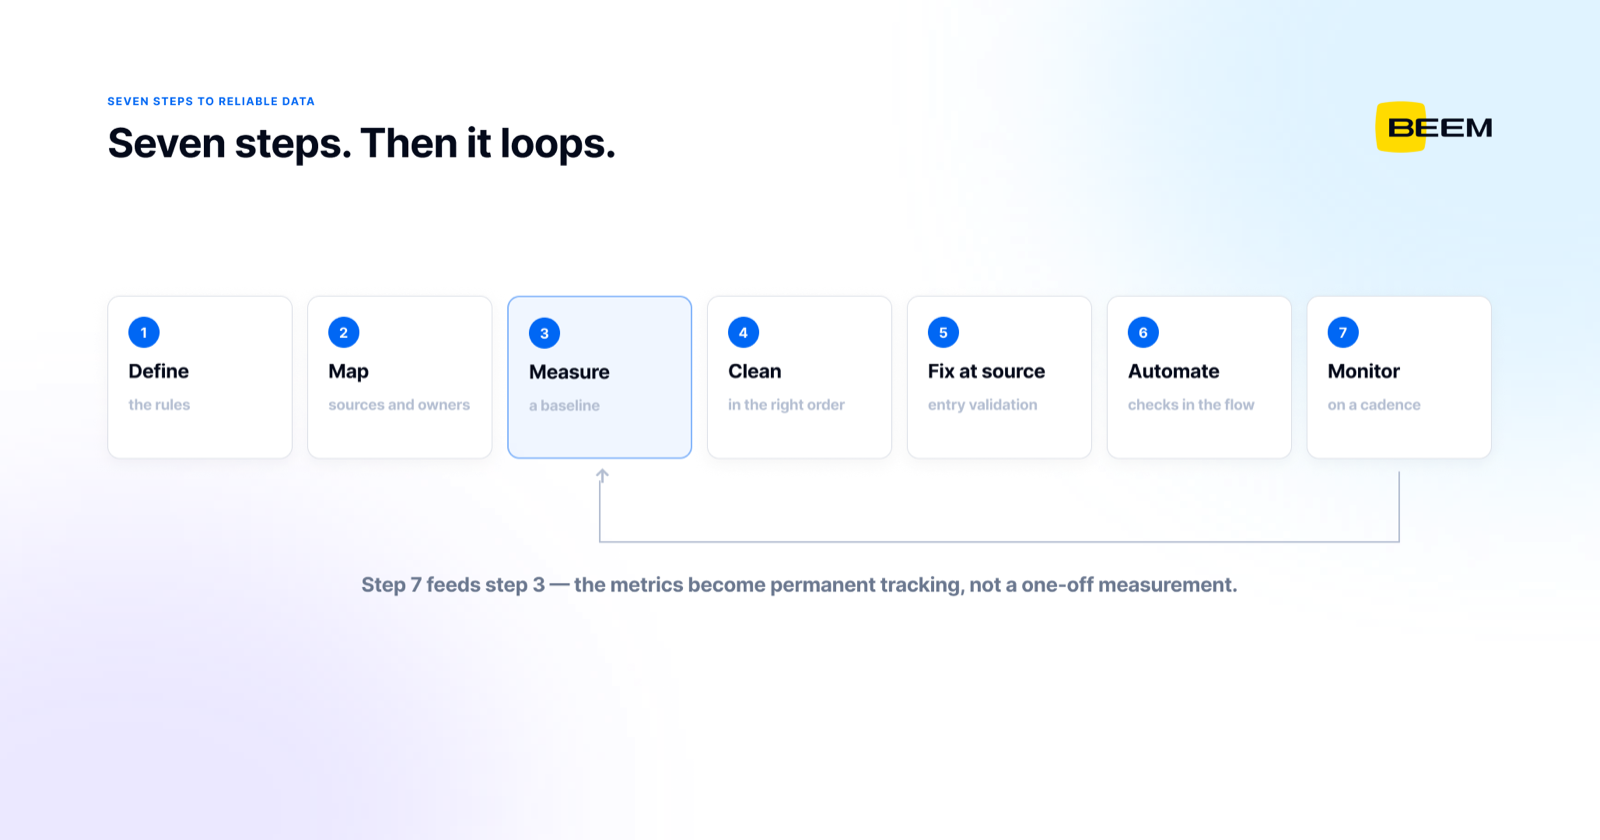
Published data quality best practices look much the same from one framework to the next. What differs is the order you apply them in, and that is where most efforts go wrong. They start by picking a cleansing tool when nothing has been defined or measured yet. The short answer to how to improve data quality is to run these steps in sequence on a narrow scope.
1. Define what reliable means, domain by domain
Before any check, write the rules down. A customer number follows a given format. An invoice cannot exist without a due date. A company name is spelled one way. These rules look obvious as long as they stay implicit, and stop looking obvious the moment you compare what three teams have entered. Work domain by domain, customers, products, projects, employees, rather than across the whole company at once. Companies with many shared reference records often formalize this stage as master data management, with a single governed definition per business object.
2. Map the sources and name an owner for each
Every system that produces or modifies data goes into the inventory, with its refresh frequency and its business owner. The connections between systems belong on the map too, including the manual exports nobody documented. The map is also where you designate a system of record per data type, the one that wins by default, so the question is settled before it becomes urgent. Who decides when the CRM and the ERP show two different addresses for the same customer? Without a name attached to each source, that question stays open for months.
3. Measure before you fix
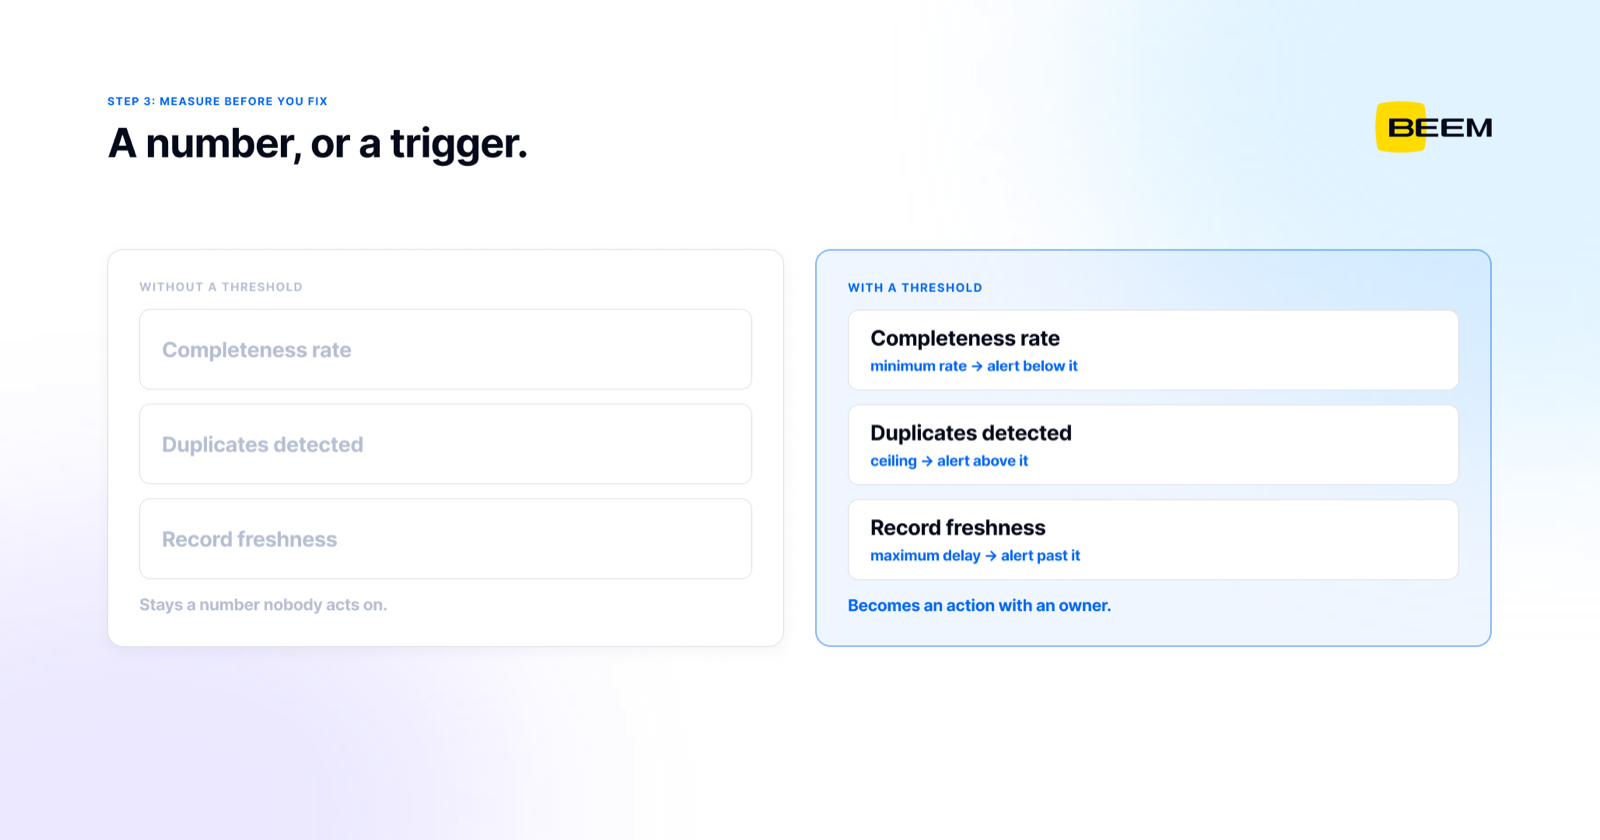
Data quality metrics turn an impression into a finding. Completeness rate per mandatory field, number of duplicates detected, gap between two systems on the same indicator, average record freshness, share of records failing the rules written in step one. That baseline is what lets you show later that the effort produced something.
Four or five indicators tracked seriously beat a battery of measures nobody looks at. Each one benefits from an explicit threshold, say a minimum completeness rate on the fields feeding invoicing, or a maximum delay between a record being created and appearing in reports. Without a threshold a metric stays a number; with one, it triggers an action.
4. Clean in the right order
Cleaning follows a sequence that matters. Standardize formats first, dates, currencies, units, text case. Deduplicate next. Reconcile identities across systems. Fill remaining gaps last. Deduplicating before standardizing means comparing records that do not resemble each other yet, and letting obvious duplicates through. Whether you use data cleansing tools or your own logic, these treatments are better built into the transformation pipelines than redone by hand every cycle.
Identity reconciliation deserves particular attention, because that is where mistakes cost the most. You have to decide what makes two records the same, an account number, an email domain, a combination of criteria, and above all which system wins when values differ. A badly tuned merge destroys information instead of producing it, and the loss surfaces months later.
5. Fix at the source whenever you can
A record corrected downstream will be wrong again at the next load if the cause stays upstream. Entry validation, closed value lists, mandatory fields, format checks at typing time: this is often a form change rather than a technical project. In many cases it is the intervention that takes the least effort for the most lasting effect, and it is still the one most often skipped, because it means talking to the teams doing the data entry.
6. Automate the checks inside the flows
Automated data tests running at every load verify the rules defined above: changed schema, abnormal volume, out-of-range values, a join returning nothing, an empty mandatory field. The flow alerts or stops before the data reaches a report. Without that automation, quality rests on one person reviewing the numbers before they go out, which holds until their vacation.
Decide in advance what a failed check does. Blocking the load protects the reports but can leave a dashboard empty on a Monday morning; letting the data through with an alert keeps things moving and puts the burden on whoever reads the alert. A middle path works well: quarantine the failing records, load the rest, and give someone a named responsibility for clearing the quarantine.
7. Monitor and report over time
The metrics from step three become permanent tracking, published in the same place as everything else. A quality dashboard reviewed on a fixed cadence keeps the subject visible, leadership included. A monthly look at triggered alerts and at the rules broken most often shows where to put the next effort, and keeps the program from stopping once the cleanup is done.
The framework and ownership that hold it together
A data quality framework documents who defines the rules, who applies them, who settles disagreements and how often the whole thing is reviewed. It is the shortest document in the project and the one that decides whether it survives the departure of whoever started it. This is also where quality meets data governance, since both rest on the same question of ownership.
In Quebec, Law 25 adds a regulatory dimension for anything involving personal information: consent, retention periods, traceability of access. Data duplicated across five systems makes those obligations considerably harder to meet, which gives quality a compliance argument on top of the operational one. Access and retention rules get set at the same moment as the quality rules, on the same flows.
That leaves the resourcing question. An internal team keeps control but ties up scarce skills. A self-service tool lowers the technical barrier while leaving configuration and monitoring with the company. A managed platform and service takes on the checks and their daily operation. That is the approach BEEM favors, with platform and support in the same engagement.
Are your teams still spending hours reconciling files before every report? See how BEEM makes your data dependable and takes on the checks day to day, without tying up an internal technical team.
