
The main Power BI alternatives in 2026 range from other dashboard tools like Tableau and Looker to all-in-one platforms that handle the data before it reaches a chart. Power BI is strong at visualization. It also assumes your data already sits clean and modeled in a warehouse, which is the part most teams struggle with.
BEEM belongs on this list as the all-in-one option. It connects your sources, stores the data in a built-in warehouse on Amazon Redshift, transforms it, and builds the dashboards, with AI Insights on top. If you already own Power BI, BEEM can feed it instead of replacing it. So the real question is bigger than which dashboard tool to pick. It is whether you need a standalone BI tool at all, or the whole pipeline behind it.
Why teams look beyond Power BI
Power BI is Microsoft's business intelligence tool. It connects to data sources, models them, and turns them into interactive dashboards. Teams look for alternatives for three main reasons.
- It is only the dashboard layer. Power BI shows your data. It does not move it from your systems, store it, or clean it. You still need connectors, a warehouse, and a transformation step before Power BI can do its job.
- It assumes clean data arrives on time. Reports break when a source changes or a refresh fails upstream. Power BI has no control over that pipeline, so someone on your team has to own it.
- Licensing and the Microsoft ecosystem. Costs grow as you add Pro and Premium seats. Some features work best when the rest of your stack is Microsoft too.
The top Power BI alternatives at a glance
| Platform | Type | Pricing model | Implementation complexity | Best for |
|---|---|---|---|---|
Recommended | All-in-one data platform | From $899/mo + usage ($0.60/DPU, $0.10/GB) | Low | Mid-market teams that want dashboards without a stack |
| Power BI | BI and visualization | Per-user license | Medium | Microsoft shops with data already in a warehouse |
| Tableau | BI and visualization | Per-user license | Medium | Deep, flexible visual exploration |
| Looker | BI and semantic layer | Quote-based | High | A governed metrics layer in code |
| Qlik Sense | BI and visualization | Per-user and capacity | Medium | Associative, in-memory exploration |
| Metabase | BI and self-serve queries | Open source and cloud | Low | Simple dashboards on a budget |
| Google Looker Studio | BI and dashboards | Free | Low | Google Ads, GA4, and Sheets |
Power BI alternatives compared
Tableau
Tableau is one of the most capable visualization tools available. Analysts use it for deep, flexible exploration, and its charting goes well beyond what most teams need. It handles large, complex datasets with ease.
The tradeoff is cost and skill. Tableau is priced per user and rewards people who invest time in learning it. Like Power BI, it sits at the top of the stack. You still need to move, store, and model your data before Tableau can visualize it. We compare the closest options in our Tableau alternatives guide.
Looker
Looker, now part of Google Cloud, is built around a governed semantic layer. You define metrics once in code, and everyone queries the same definitions. That consistency is valuable for larger data teams.
The cost is complexity. Looker expects a modeled warehouse and engineers who can maintain its LookML layer. Pricing is quote-based and aimed at bigger budgets. It is powerful, but it is not a quick self-serve option for a small team. Our Looker alternatives guide compares the closest options.
Qlik Sense
Qlik Sense uses an associative, in-memory engine that lets people explore data from any angle. It is fast, and its model surfaces connections that a linear drill-down can miss. Teams that like open-ended analysis tend to like Qlik.
The learning curve is real, and the pricing mixes per-user and capacity costs. As with the others here, Qlik is a visualization layer. The data still has to arrive clean and modeled from somewhere upstream.
Metabase
Metabase is the simplest option on this list. It is open source, quick to set up, and lets non-technical people ask questions without SQL. For a small team on a budget, it covers a lot of ground.
It trades depth for that simplicity. Advanced modeling and governance are limited compared with Power BI or Looker. And it still connects to a database you have to build and maintain yourself.
Google Looker Studio
Google Looker Studio, formerly Data Studio, is free and connects easily to Google Ads, GA4, and Sheets. For marketing dashboards inside the Google ecosystem, it is hard to beat on price.
It slows down on larger, blended datasets, and its modeling is basic. Looker Studio works best as a reporting layer on data that is already clean. It is not built to run your whole analytics stack.
BEEM
BEEM is a managed data platform that covers the full path to a dashboard. It connects to 750+ sources, stores your data in a built-in warehouse on Amazon Redshift, transforms it with SQL, and builds dashboards with AI Insights for plain-language questions. A managed team is available when you need help, so you are not staffing the pipeline yourself.
BEEM is not a replacement for Power BI's visualization depth. If your analysts live in Power BI, BEEM feeds it clean, modeled data instead of competing with it. Where BEEM stands apart is scope. It is the one platform that owns everything before and around the dashboard, so reporting stops being a manual-refresh island. First dashboards can be live in as little as 2 weeks, often at 40-60% less than building an in-house solution.
How to choose between Power BI alternatives
Match the tool to the problem you actually have.
- Do you have a warehouse? If not, a BI tool alone will not solve your reporting. You need the data layer first.
- Who maintains it? Count the connectors, refreshes, and models someone has to own. That is the hidden cost.
- How technical is your team? Looker and Qlik reward engineers. Metabase and Looker Studio suit smaller, leaner teams.
- What is the real total cost? Add licenses, a warehouse, ingestion, and the people to run them, not just the dashboard seat.
- Do you want tools or outcomes? Assemble the pieces yourself, or run one managed platform that delivers the result.
The all-in-one alternative to a Power BI stack
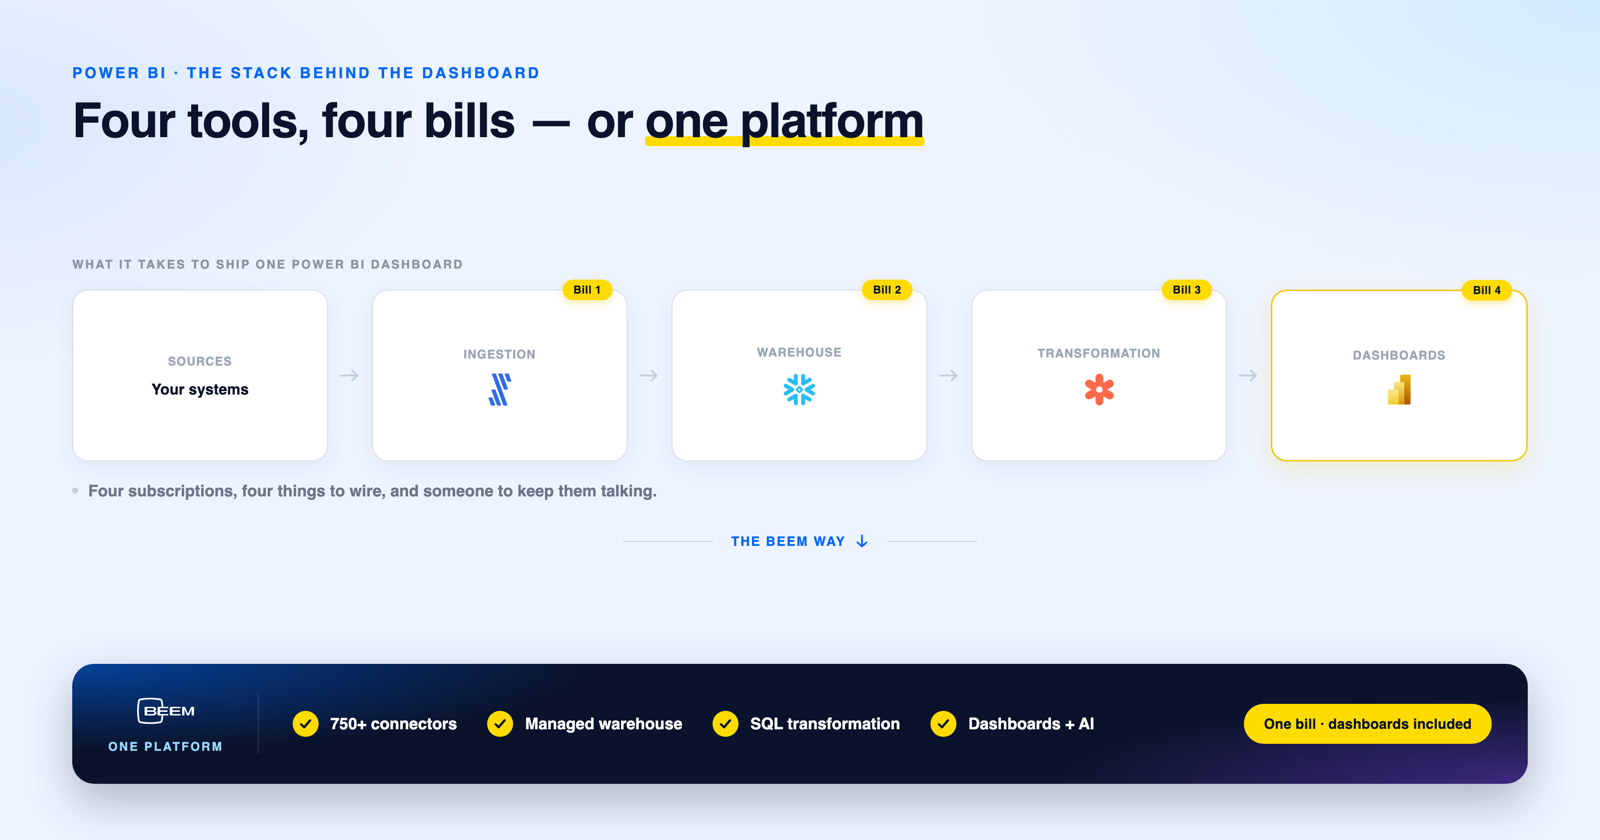
Most Power BI setups are really four or five tools wired together. Connectors move the data, a warehouse stores it, a transformation step models it, and Power BI shows it. Each piece is a separate bill and a separate thing to maintain.
BEEM replaces that stack with one platform. Connectors, a built-in warehouse, SQL transformation, and dashboards with AI Insights all live in one place. BEEM plans start at $899/mo, plus usage-based data processing from $0.60 per DPU and storage at $0.10/GB. You pay one vendor for the whole stack instead of separate bills for connectors, a warehouse, transformation, and a BI tool.
To be clear about fit. If all you want is the deepest possible visualization and you already have a warehouse and engineers, keep Power BI or Tableau. BEEM is for teams that want the whole outcome, from raw source to live dashboard, without assembling and maintaining the stack. And if you keep Power BI, BEEM can sit underneath it as the data layer that feeds it.
See your own data in a dashboard, not a demo dataset. BEEM connects a source and shows you a live dashboard built on it, so you can judge with your own numbers. Book a demo.
