
Definition
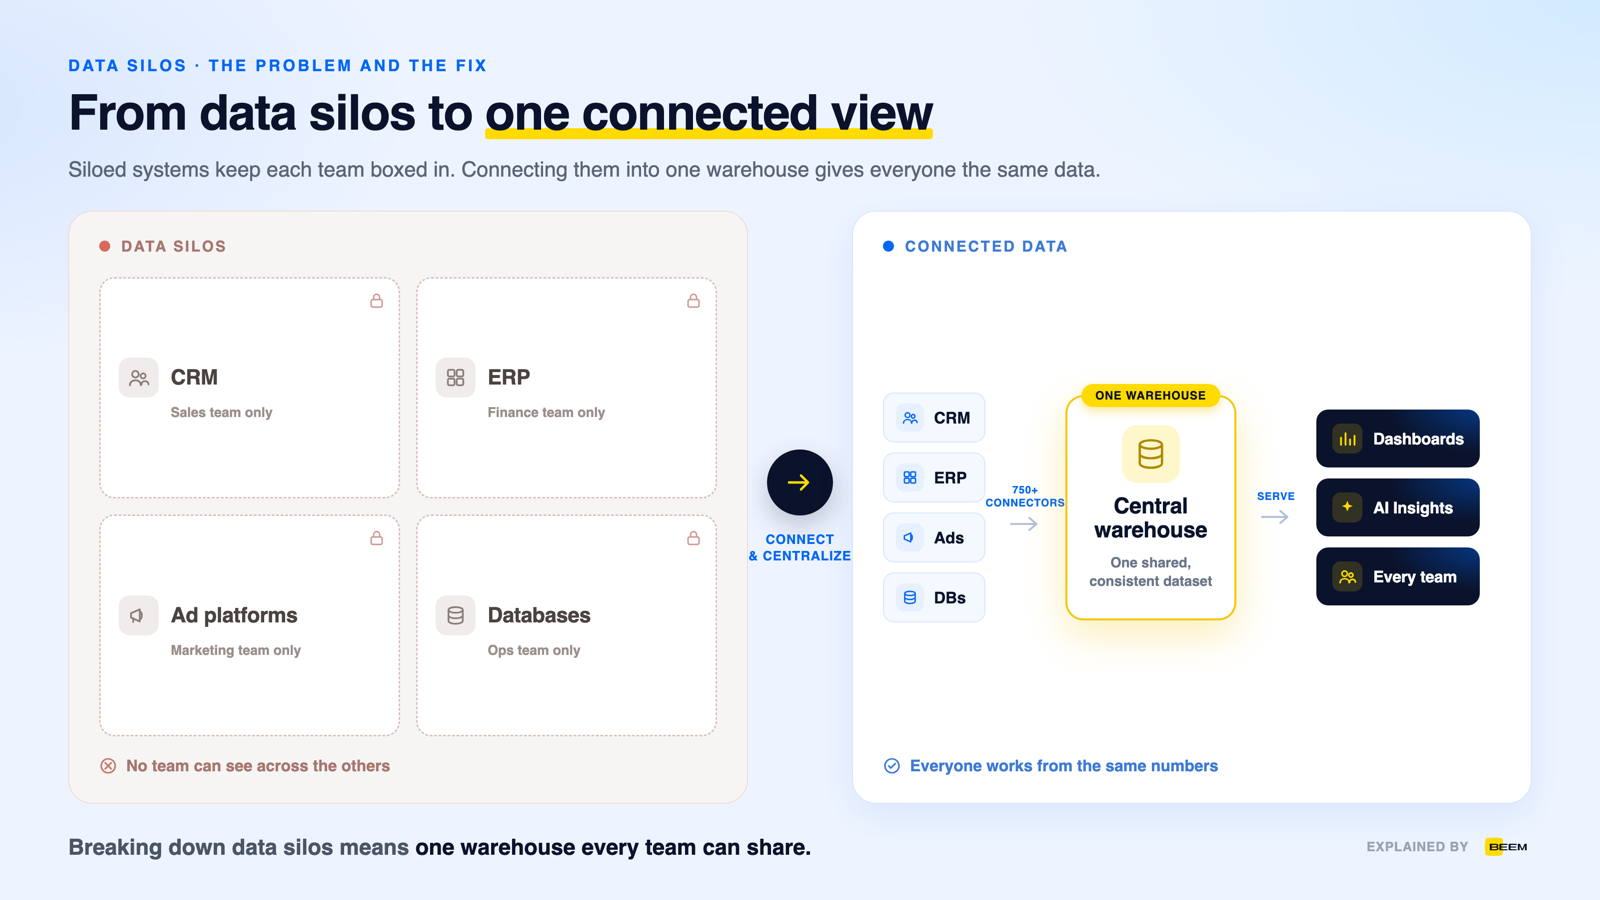
Data silos are data trapped in separate systems that don't talk to each other. Each team keeps its numbers in its own tool, so sales data sits in a CRM, finance data in an ERP and marketing data in ad platforms.
Nobody can see the full picture because no single view pulls it all together.
How it works
Data silos are caused by teams, tools and systems that store data separately and were never connected. They build up over time rather than by design, and most companies end up with several at once.
- Departmental tools — sales, finance and marketing each buy the software they need, and those tools rarely share data out of the box.
- Incompatible formats — each system stores records its own way, so the same customer or order looks different in every tool.
- Legacy and merged systems — old platforms and data inherited through an acquisition often can't connect to anything modern.
- No shared destination — without a central warehouse to land in, data stays put in whatever app created it.
The common thread is a missing connection. When there is no data pipeline moving data into one shared place, every tool becomes an island. Breaking silos down means connecting every source into one place teams can share, and most companies work through three moves.
How it compares
The clearest way to see what silos cost is to put the two states side by side. Nothing in the siloed column is broken on its own, because each tool works and each team gets an answer out of it. The problem only appears when the business tries to look across them.
| Siloed | Integrated | |
|---|---|---|
| Where the data lives | Inside whichever application created it | Combined in a central warehouse every team reads from |
| Who can reach it | The department that owns the tool, plus anyone willing to request an export | Anyone with the right role, without a request queue |
| Reporting consistency | Each tool produces its own version of the number | One modeled definition sits behind every report |
| Typical failure | Two teams bring different revenue figures to the same meeting | A definition drifts and has to be re-agreed, but only in one place |
When your business needs one
- Two teams present different revenue figures for the same period, each from its own system.
- Answering a routine question means requesting exports from three departments.
- Nobody can connect marketing spend to product usage to revenue, because the three sit in unconnected tools.
- The same customer or order appears under a different identifier in every tool.
- An AI assistant or BI tool gives thin answers because it can only reach part of the data.
Benefits and limits
- Numbers stop disagreeing, because every report reads the same integrated data and revenue means the same thing in finance as it does in sales.
- The reconciliation work disappears, so nobody spends the week stitching exports together by hand.
- Cross-functional questions become answerable, since marketing spend, product usage and revenue can finally be looked at in one view.
- Analytics and AI see the whole business rather than one department's slice, which is what makes their answers worth acting on.
- Access is governed once, centrally, instead of depending on who happens to have a login to which tool.
- Conflicting numbers — two teams report different revenue because each reads from a different system, and trust in the data drops.
- Wasted time — people spend hours exporting spreadsheets and stitching them together by hand instead of analyzing.
- Blind spots — leaders can't connect marketing spend to product usage to revenue, so decisions rest on guesswork.
- AI that can't help — an AI assistant is only as good as the data it reaches, and siloed data gives it half the story.
- Data silos are the default outcome of growth, not a design decision: each department buys the tool it needs and nothing connects them.
- The cost is conflicting numbers, manual reconciliation, blind spots between functions, and analytics or AI that can only see part of the business.
- Breaking them down takes integration, a central warehouse and shared governance; the technology is well understood, and the harder part is teams agreeing to share.
Frequently Asked Questions
What are data silos in simple terms?
Data silos are data kept in separate systems that don't share with each other. Each team stores its numbers in its own tool, so sales data lives in a CRM and finance data in an ERP, and no single view brings them together. That makes it hard to see the full picture of the business.
What is an example of a data silo?
A common example is a marketing team tracking leads in a CRM while the product team tracks usage in a separate platform. Because the two tools don't share data, no one can connect a campaign to the product activity it drove. The information exists, but it stays locked in two systems that never meet.
What causes data silos?
Data silos are caused by teams and tools that store data separately and were never connected. Departments buy their own software, systems use incompatible formats, and legacy or merged platforms can't talk to each other. Without a central warehouse for data to land in, each tool keeps its data to itself.
Why are data silos a problem?
Data silos are a problem because they hide the full picture and force decisions on partial information. Teams report conflicting numbers, waste hours reconciling exports, and lose the connections between departments. Siloed data also limits AI and analytics, which need combined data to give useful answers.
How do you break down data silos?
You break down data silos by integrating every source into one central place teams can share. Data integration pulls data from each tool and reshapes it, a data warehouse holds the combined result, and shared governance keeps definitions and access consistent so teams trust and use the unified data.
Does BEEM help break down data silos?
Yes. BEEM uses 750+ pre-built connectors to load your separate sources into a built-in data warehouse on Amazon Redshift, then adds dashboards, transformation and AI Insights on top with role-based access. Instead of scattered tools, teams work from one shared dataset. Plans start at $899/mo, with usage-based data processing from $0.60 per DPU.
