
Definition
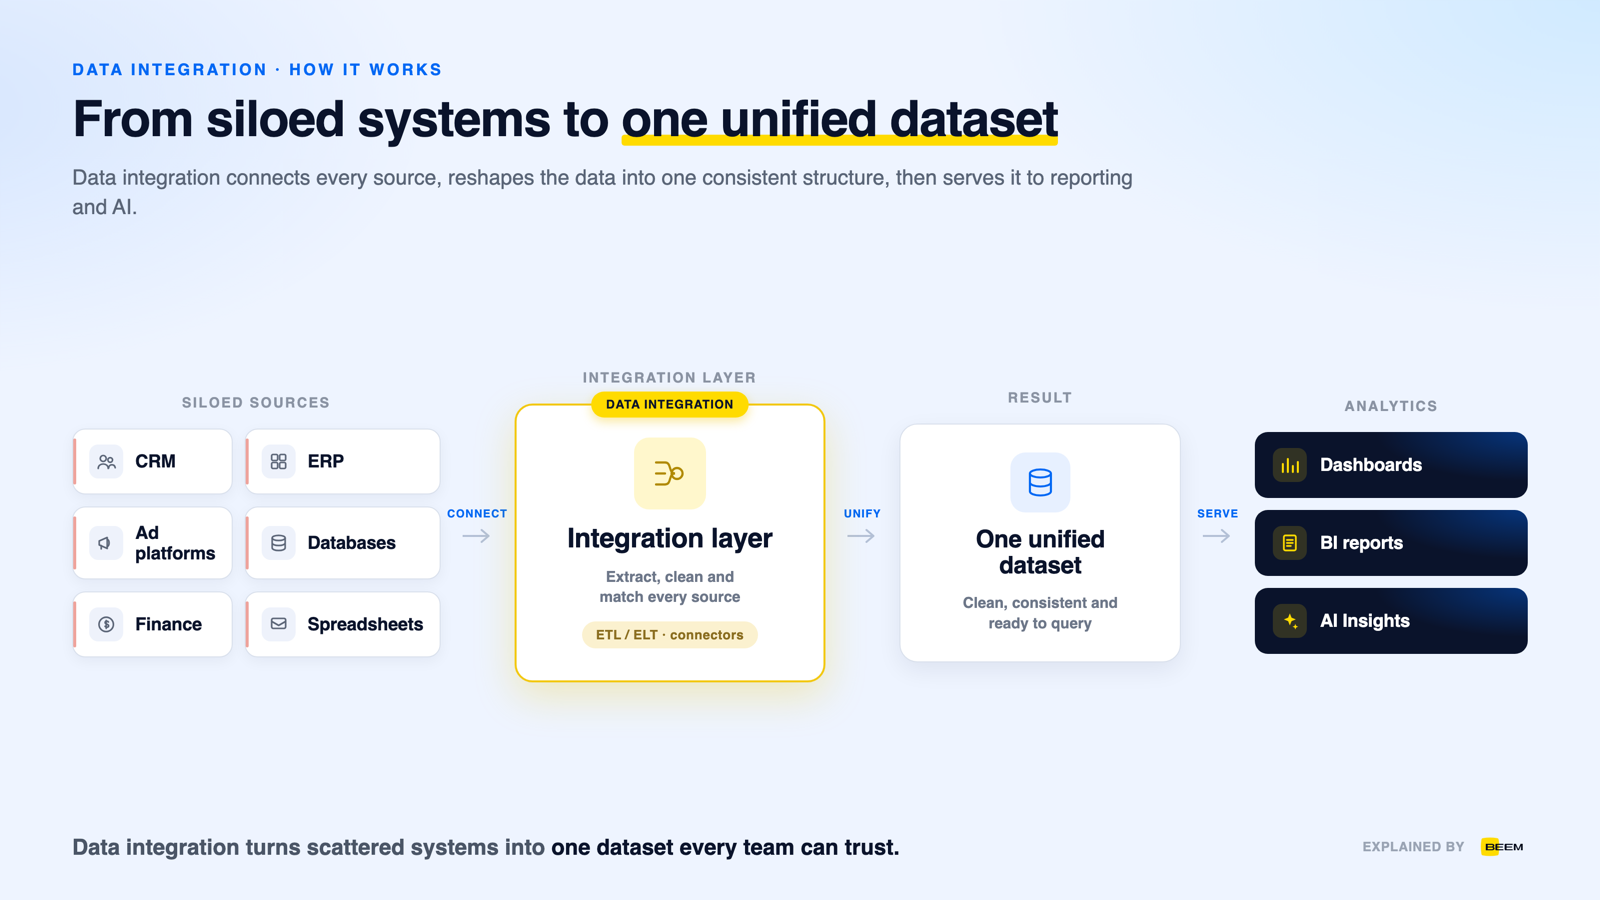
Data integration is the process of combining data from many separate systems into a single, consistent view a business can use. It connects sources like a CRM, an ERP and ad platforms, then moves and reshapes their data so every report reads from one clean set of numbers instead of scattered exports.
How it works
Data integration works by pulling data out of each source system, reshaping it into a common structure, and delivering it to one place where it can be queried. Most setups run through three stages.
Integration can run on a schedule as a batch, or closer to real time as data changes. It also differs from a one-time data migration, which moves data once and stops. Data integration keeps the connection open, so the combined view stays current as sources change.
How it compares
There are four common data integration methods: ETL, ELT, data virtualization and API-based integration. They mostly differ in where and when the data gets transformed.
- ETL (extract, transform, load) — data is cleaned and reshaped before it lands in the warehouse.
- ELT (extract, load, transform) — data is loaded first, then transformed inside the warehouse. This suits large volumes and cloud warehouses that can do the work.
- Data virtualization — data stays in its source and is read through a virtual layer, so no physical copy gets moved.
- API and iPaaS — applications trade data directly through APIs, often managed by an iPaaS platform that keeps the connections running.
| Method | How the data moves | Best for |
|---|---|---|
| ETL | Transformed on the way, so only clean data lands | Strict schemas, and fields that must be masked before storage |
| ELT | Loaded raw, then modeled inside the warehouse | Cloud warehouses and questions that keep changing |
| Data virtualization | Left in the source and read through a virtual layer | Live reads where no second copy should exist |
| API and iPaaS | Passed between applications as events happen | Keeping operational tools in sync rather than reporting |
When your business needs one
- The numbers a decision depends on live in three or four different tools.
- Someone rebuilds the same combined report by hand every week from exports.
- The same customer or order carries a different identifier in every system.
- A new dashboard or AI assistant needs data that no single application holds.
- Departments can each reach only their own data, so nobody sees across the business.
Benefits and limits
- One source of truth — reports and dashboards read the same integrated data instead of separate exports.
- Less manual work — connectors move data on a schedule, so no one spends the week copying spreadsheets.
- Ready for AI — clean, combined data is what BI tools and AI assistants need to give useful answers.
- Data silos are the biggest hurdle, because each department can reach only its own data and has little reason to open it up.
- Every system stores records its own way, so mismatched formats and duplicate records have to be reconciled before the combined view is trustworthy.
- Keeping everything fresh is ongoing work, not a one-time project.
- Connectors break when a source API or schema changes, and someone has to notice and fix it.
- Integration combines data; it does not decide what the numbers mean, so shared definitions still have to be agreed on.
- Data integration is the goal — one consistent view across systems — while ETL, ELT, virtualization and API or iPaaS integration are the methods for reaching it.
- It is an open, ongoing connection rather than a one-time migration, so the combined view stays current as sources change.
- Common tools include Fivetran, Airbyte, Talend, Informatica and cloud iPaaS services; most connect sources and move data but leave the warehouse and reporting to be added around them.
Frequently Asked Questions
What is data integration in simple terms?
Data integration is the process of bringing data from all of a company's separate tools into one consistent place. It connects each system, cleans and matches the data, and delivers a single combined view so reports and dashboards all read from the same source instead of scattered exports.
What is an example of data integration?
A common example is pulling sales data from a CRM, orders from an ERP and spend from ad platforms into one data warehouse. Once combined, a single dashboard can show revenue, cost and customer activity together, which no individual tool could show on its own.
What are the main methods of data integration?
The main methods are ETL, ELT, data virtualization and API-based integration. ETL and ELT move data into a warehouse and differ on when it is transformed. Data virtualization queries data where it lives, and API or iPaaS integration connects applications directly to each other.
What is the difference between data integration and ETL?
Data integration is the broad goal of combining data from many sources into one view. ETL is one method for doing it, where data is extracted, transformed and then loaded into a target. ETL, ELT and data virtualization are all ways to achieve data integration.
Why is data integration important?
Data integration matters because it breaks down data silos and gives every team one trusted set of numbers. Without it, each tool holds a partial view and reports disagree. With it, dashboards and AI work from clean, combined data, so decisions rest on the same facts.
Does BEEM handle data integration?
Yes. BEEM integrates data with 750+ pre-built connectors that load your systems into a built-in data warehouse on Amazon Redshift, then adds transformation, dashboards and AI Insights in one managed platform. Plans start at $899/mo, with usage-based data processing from $0.60 per DPU.
