
Definition
Data observability is the continuous monitoring of the health of data as it moves through a pipeline. It tracks signals such as freshness (did the data arrive on time), volume (did the expected number of rows arrive), schema (did the structure change) and distribution (do the values still look normal). The point is to detect a problem and locate its cause before it reaches a dashboard or a decision.
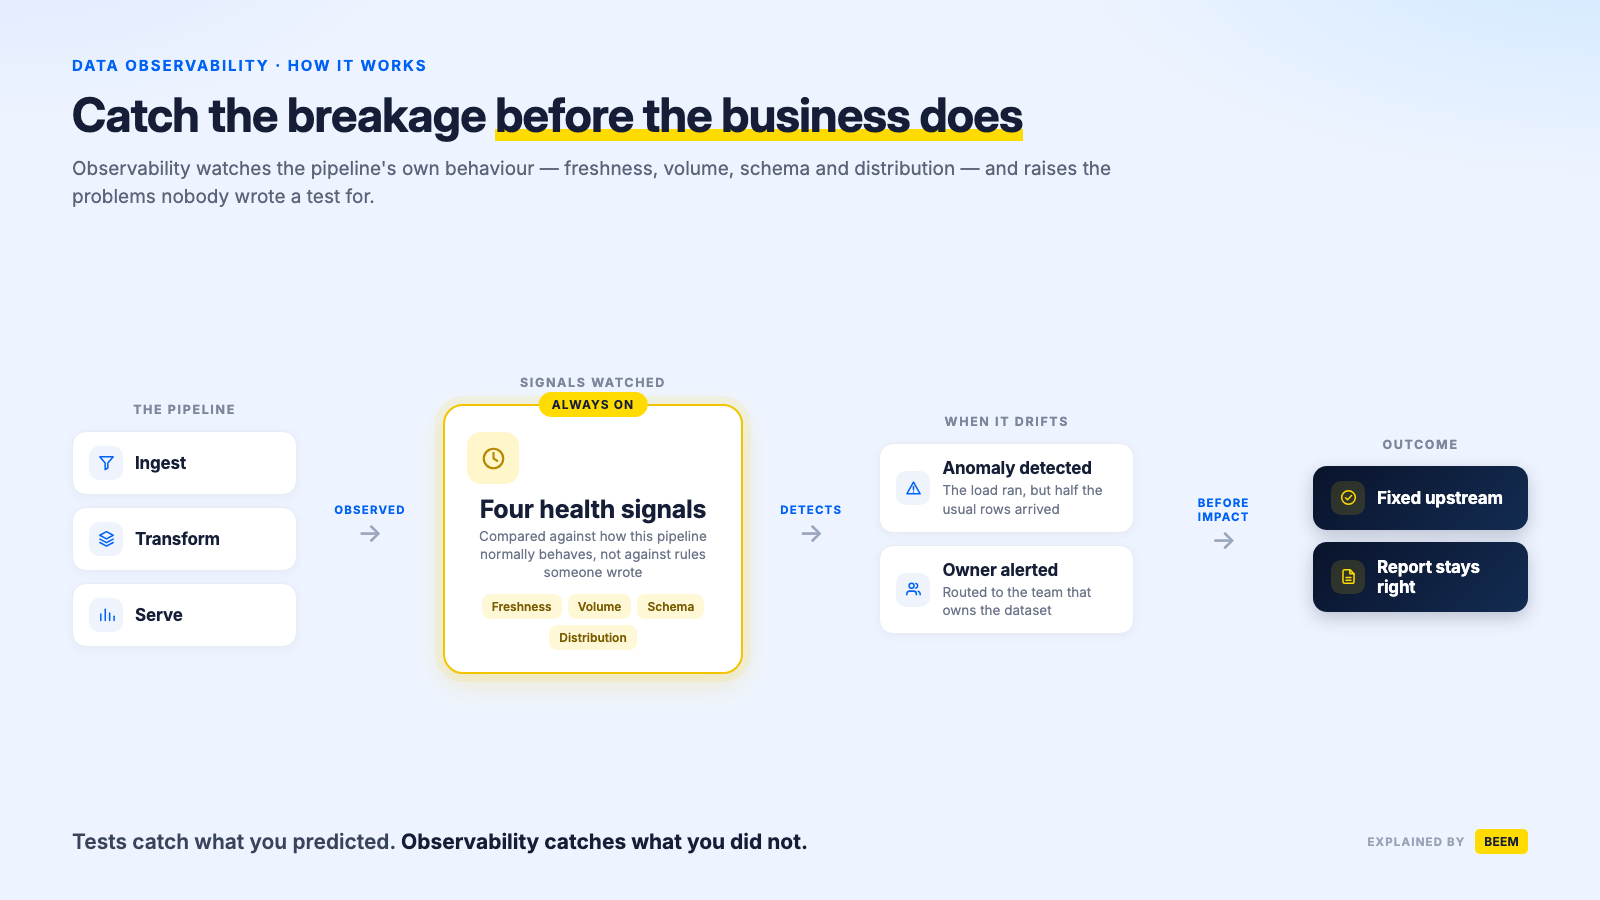
How it works
Observability is less a single tool than a feedback loop laid over an existing pipeline. Signals are collected on every run, compared against what normal looks like for that dataset, and turned into an alert with enough context to act on. The loop only pays off if that last part works, because an alert nobody can triage is just noise.
How it compares
Observability is often confused with data quality testing. The two are complementary rather than competing: tests assert what you already know should be true, while observability watches for the problems nobody thought to write a test for.
| Data quality testing | Data observability | |
|---|---|---|
| What it checks | Explicit rules you write, such as this column is unique or this total is never negative. | Broad health signals: freshness, volume, schema, distribution. |
| How it is defined | By hand, per dataset, from known requirements. | Largely from the historical behavior of the pipeline itself. |
| Best at | Catching known, business-specific failure modes. | Catching upstream or unanticipated failures. |
| Main weakness | Only finds what someone thought to test for. | Flags anomalies without knowing whether they matter, so it can be noisy. |
When your business needs one
- Someone in the business tells you a dashboard is wrong before your team knows.
- Pipelines report success but produce empty or partial tables.
- A source system changes a column and it surfaces weeks later as a broken report.
- You have no reliable answer to how fresh a given number is.
- Incidents take longer to diagnose than to fix, because nobody knows where the break started.
Benefits and limits
- Breakages are found by the team that owns them, not by the executive reading the report.
- Time to diagnose drops, because freshness, volume and schema history are recorded per run.
- Trust in reporting recovers, since staleness becomes visible instead of assumed.
- Repeat offenders become obvious, as the same flaky source shows up again and again in the record.
- Observability detects, it does not fix. Someone still has to own remediation.
- Anomaly detection needs history. On a new or low-volume pipeline the baseline is unreliable and false positives are common.
- Poorly tuned alerting is quickly ignored, and an ignored alert is worse than no alert at all.
- It watches the pipeline, not the meaning of the data. Data can be fresh, complete and correctly shaped and still be wrong at the source.
- Data observability watches freshness, volume, schema and distribution continuously, so problems surface before the business notices.
- It complements rule-based testing rather than replacing it: tests catch known failures, observability catches unexpected ones.
- Its value depends on triage, meaning signals routed to an owner with enough context to act, not simply more alerts.
Frequently Asked Questions
What are the signals of data observability?
Most implementations track four: freshness, volume, schema and distribution. Some add lineage, meaning which downstream tables and reports are affected by a given break.
Is data observability the same as data quality?
No. Data quality describes whether the data is correct and fit for use. Observability is how you find out that quality has changed, by watching the pipeline continuously rather than checking after the fact.
Do I need a dedicated observability tool?
Not always. Smaller stacks often get most of the value from run-level logging, a few assertion tests on the critical datasets, and a visible record of sync status. Dedicated tools become worthwhile as the number of pipelines and consumers grows.
How is data observability different from application monitoring?
Application monitoring tells you whether a job ran. Data observability tells you whether the data that job produced is right, because a pipeline can complete successfully and still deliver an empty table.
What does BEEM provide here?
BEEM is not a dedicated observability platform, but it covers the common ground. Monitor gives a filterable timeline of every source, dataset and flow event with a start, success, warning or fail status. Dataset tests let you attach SQL assertions that run on each refresh, set either as blockers that stop a bad load from deploying or as warnings that flag it. The Datalake shows last sync timestamps, row counts and schemas for every source table.
