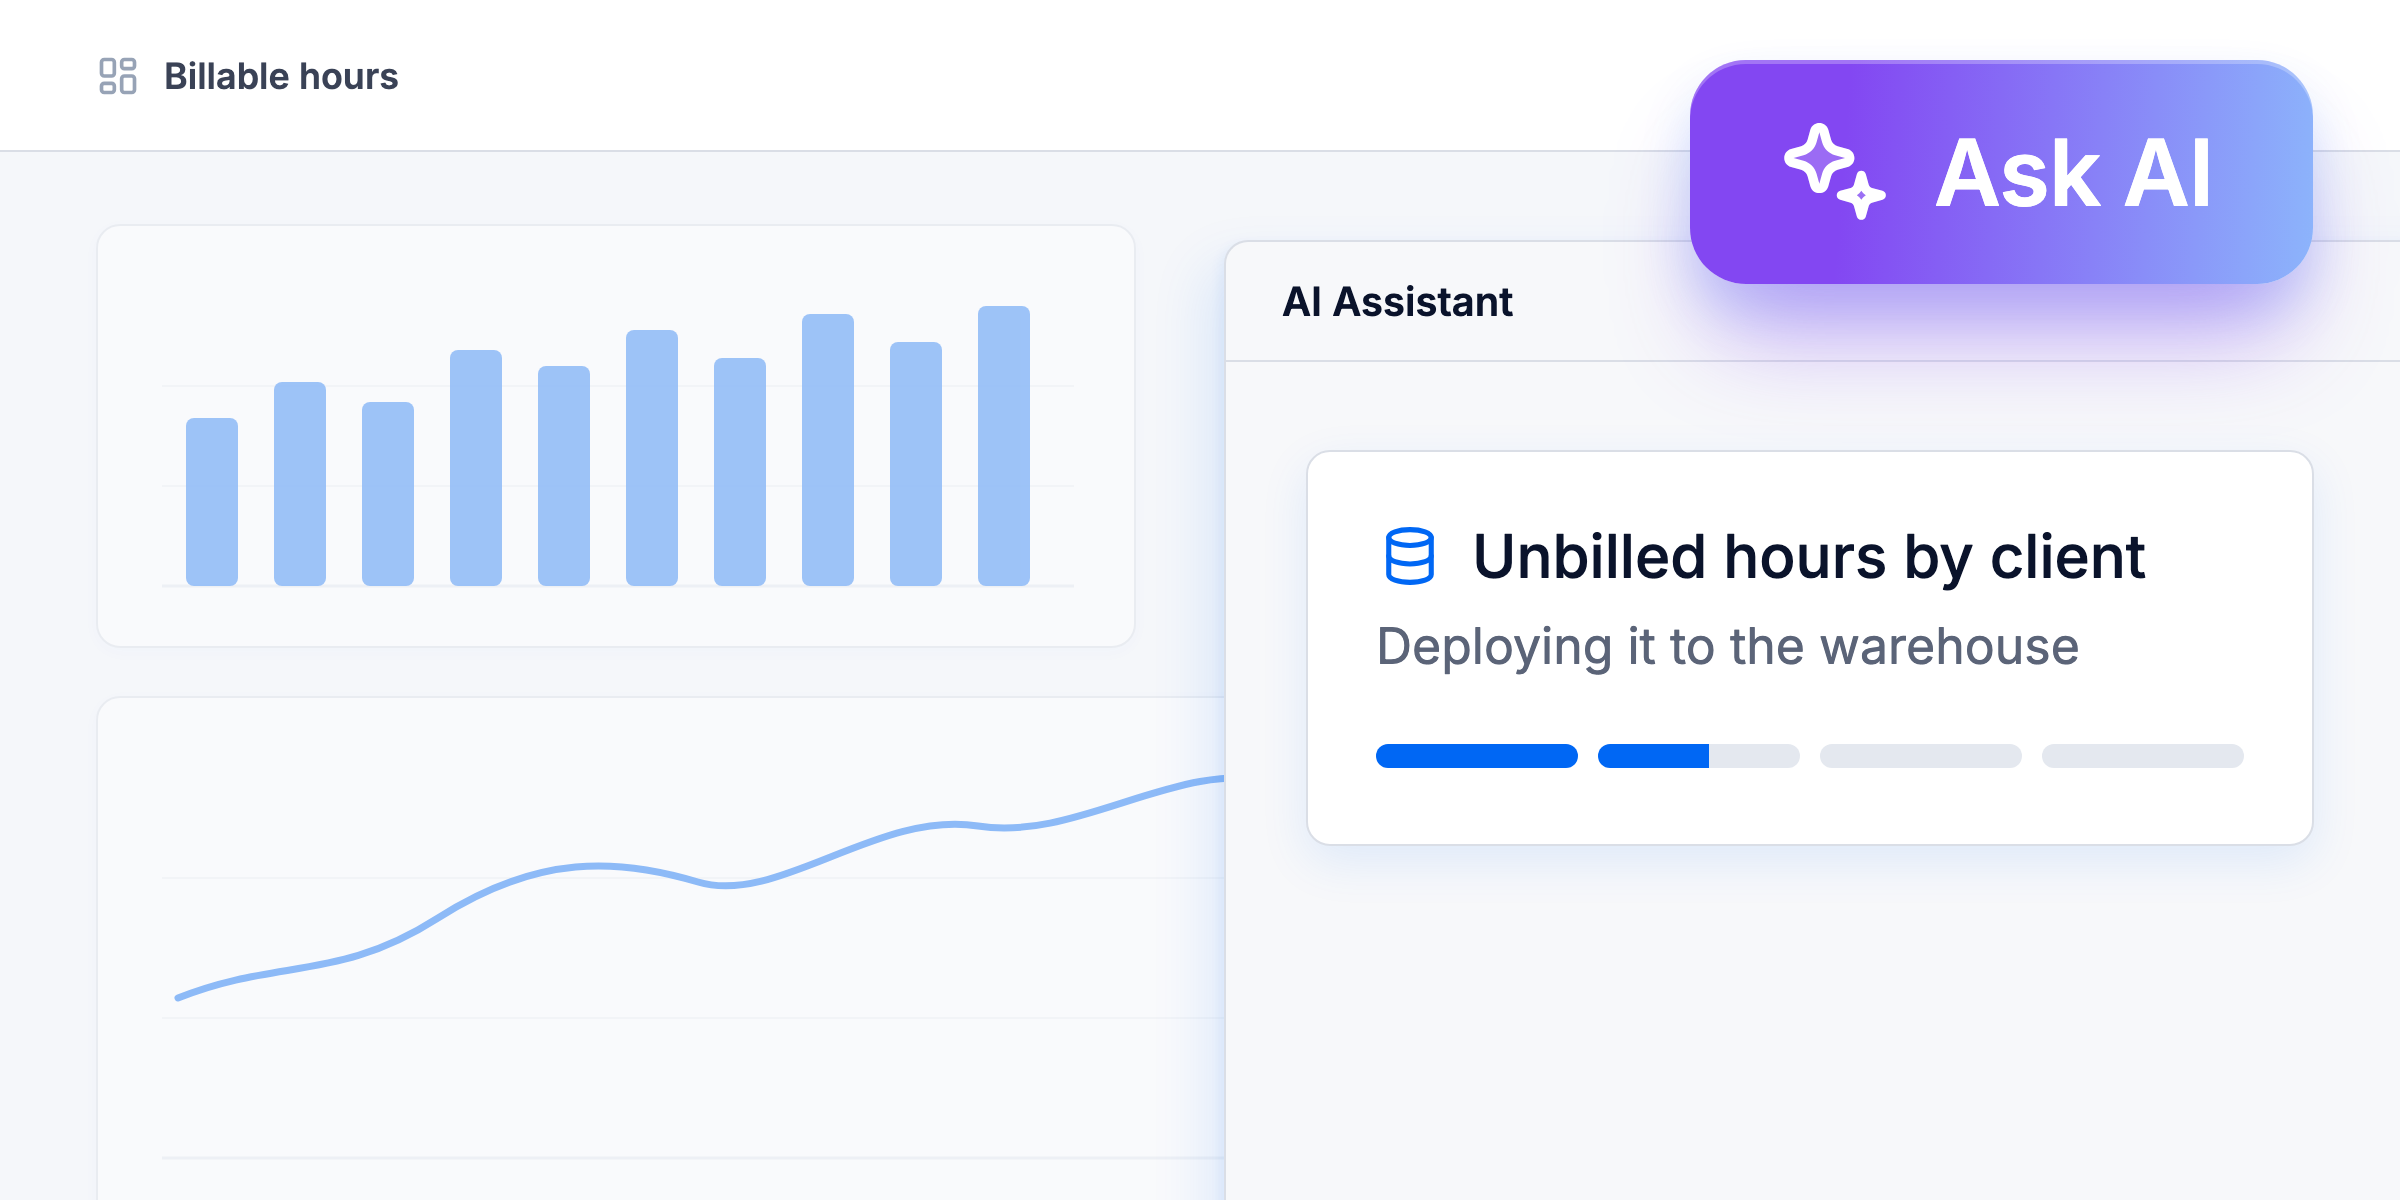
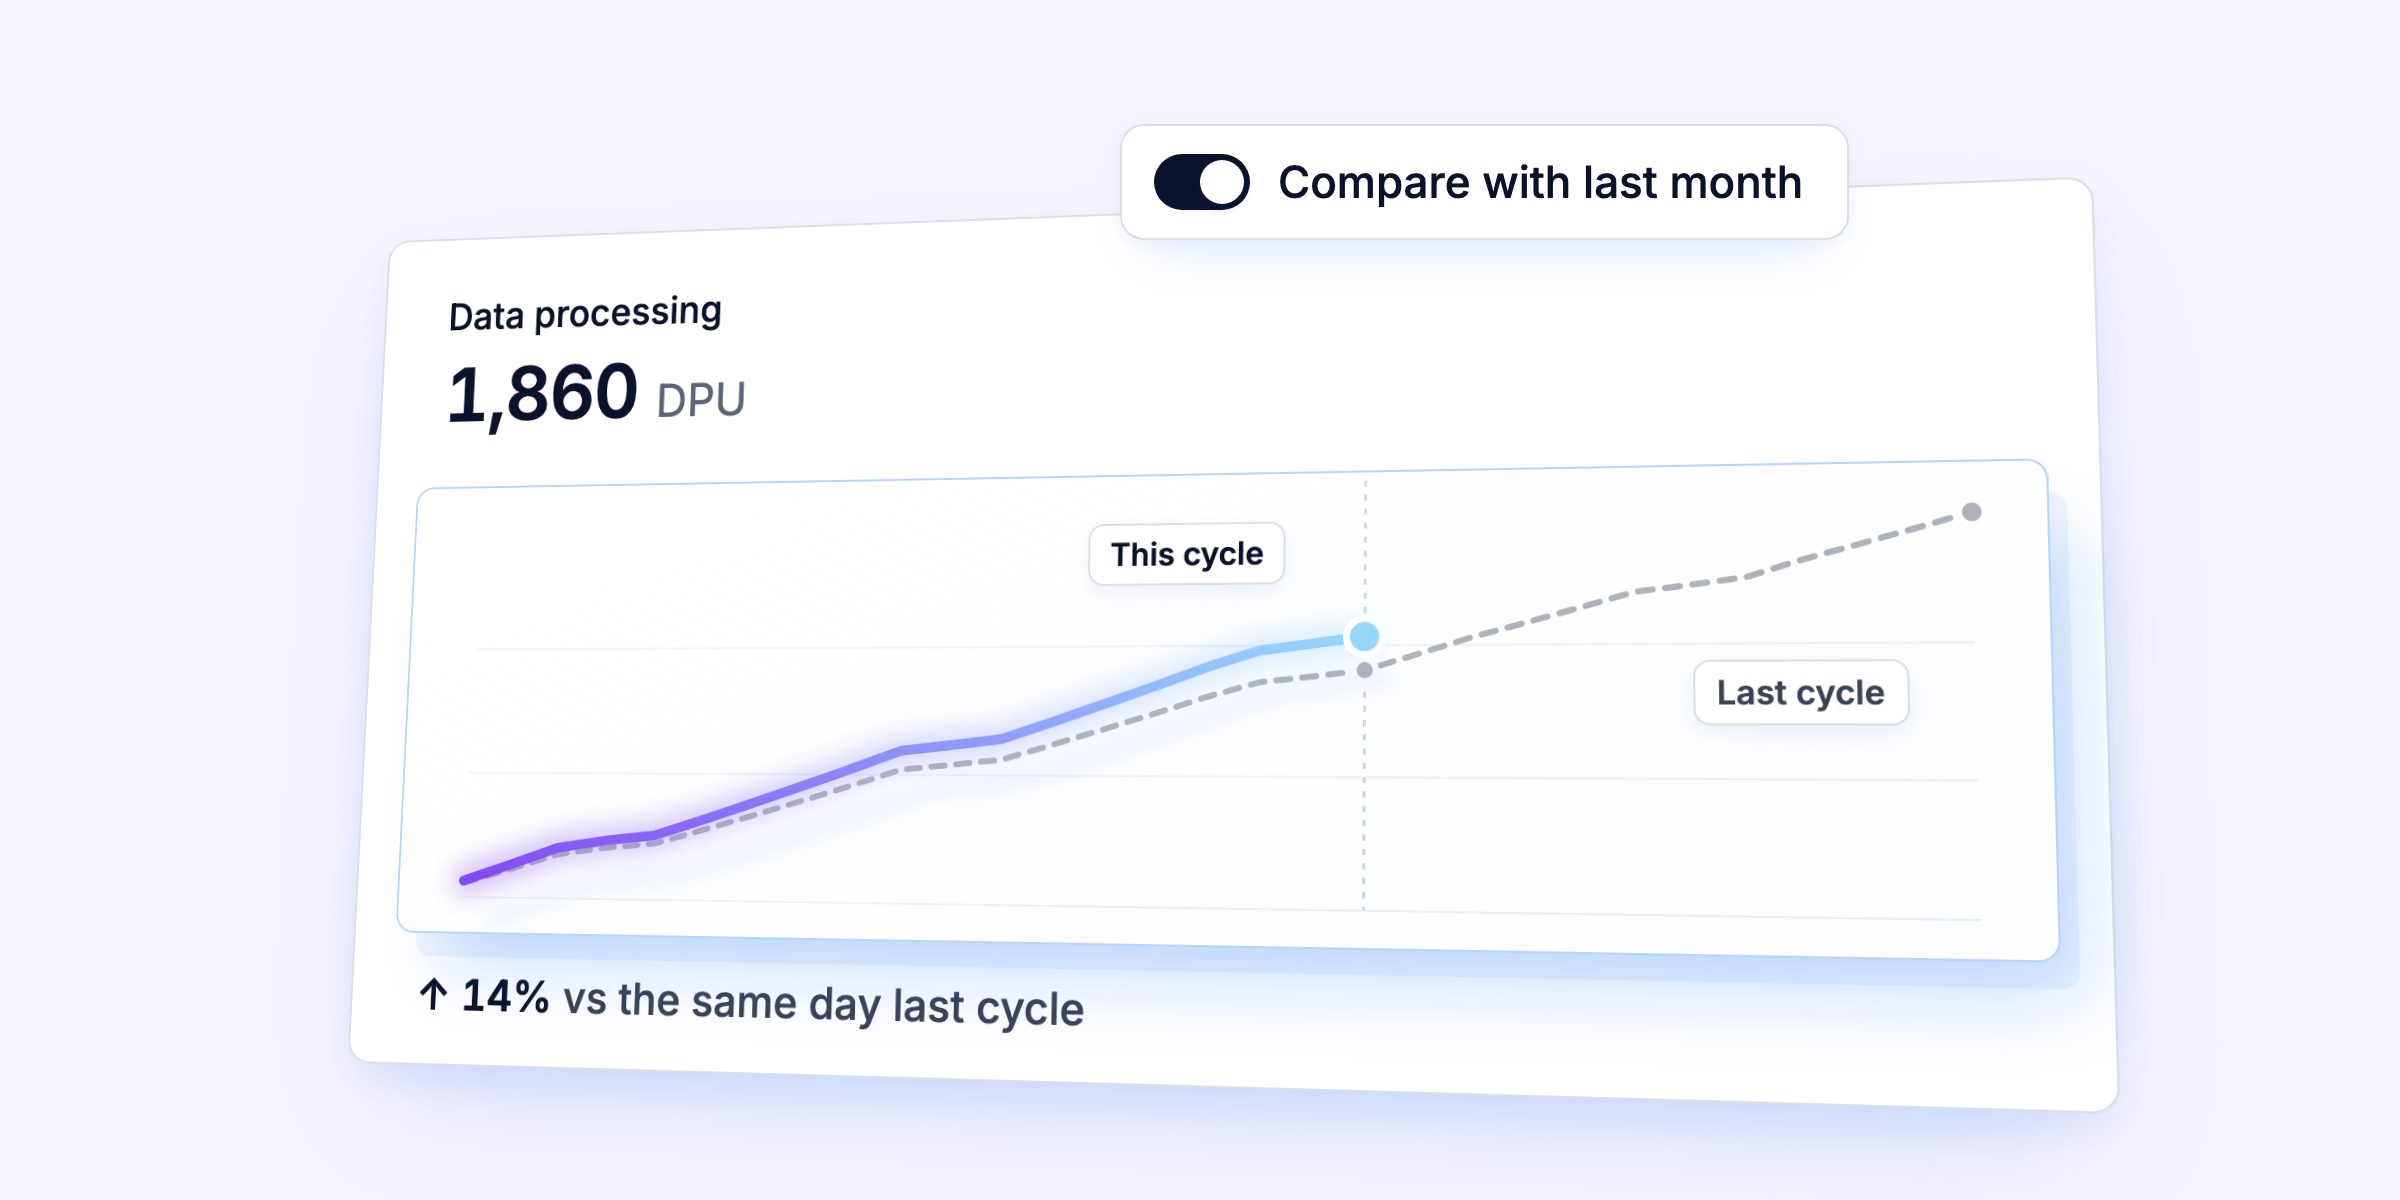
The BEEM sidebar puts your everyday business tools first
The BEEM sidebar is organized around the people who run the business: AI Assistant and Dashboards come first, data tools sit under Data & Models, and settings have screens of their own.
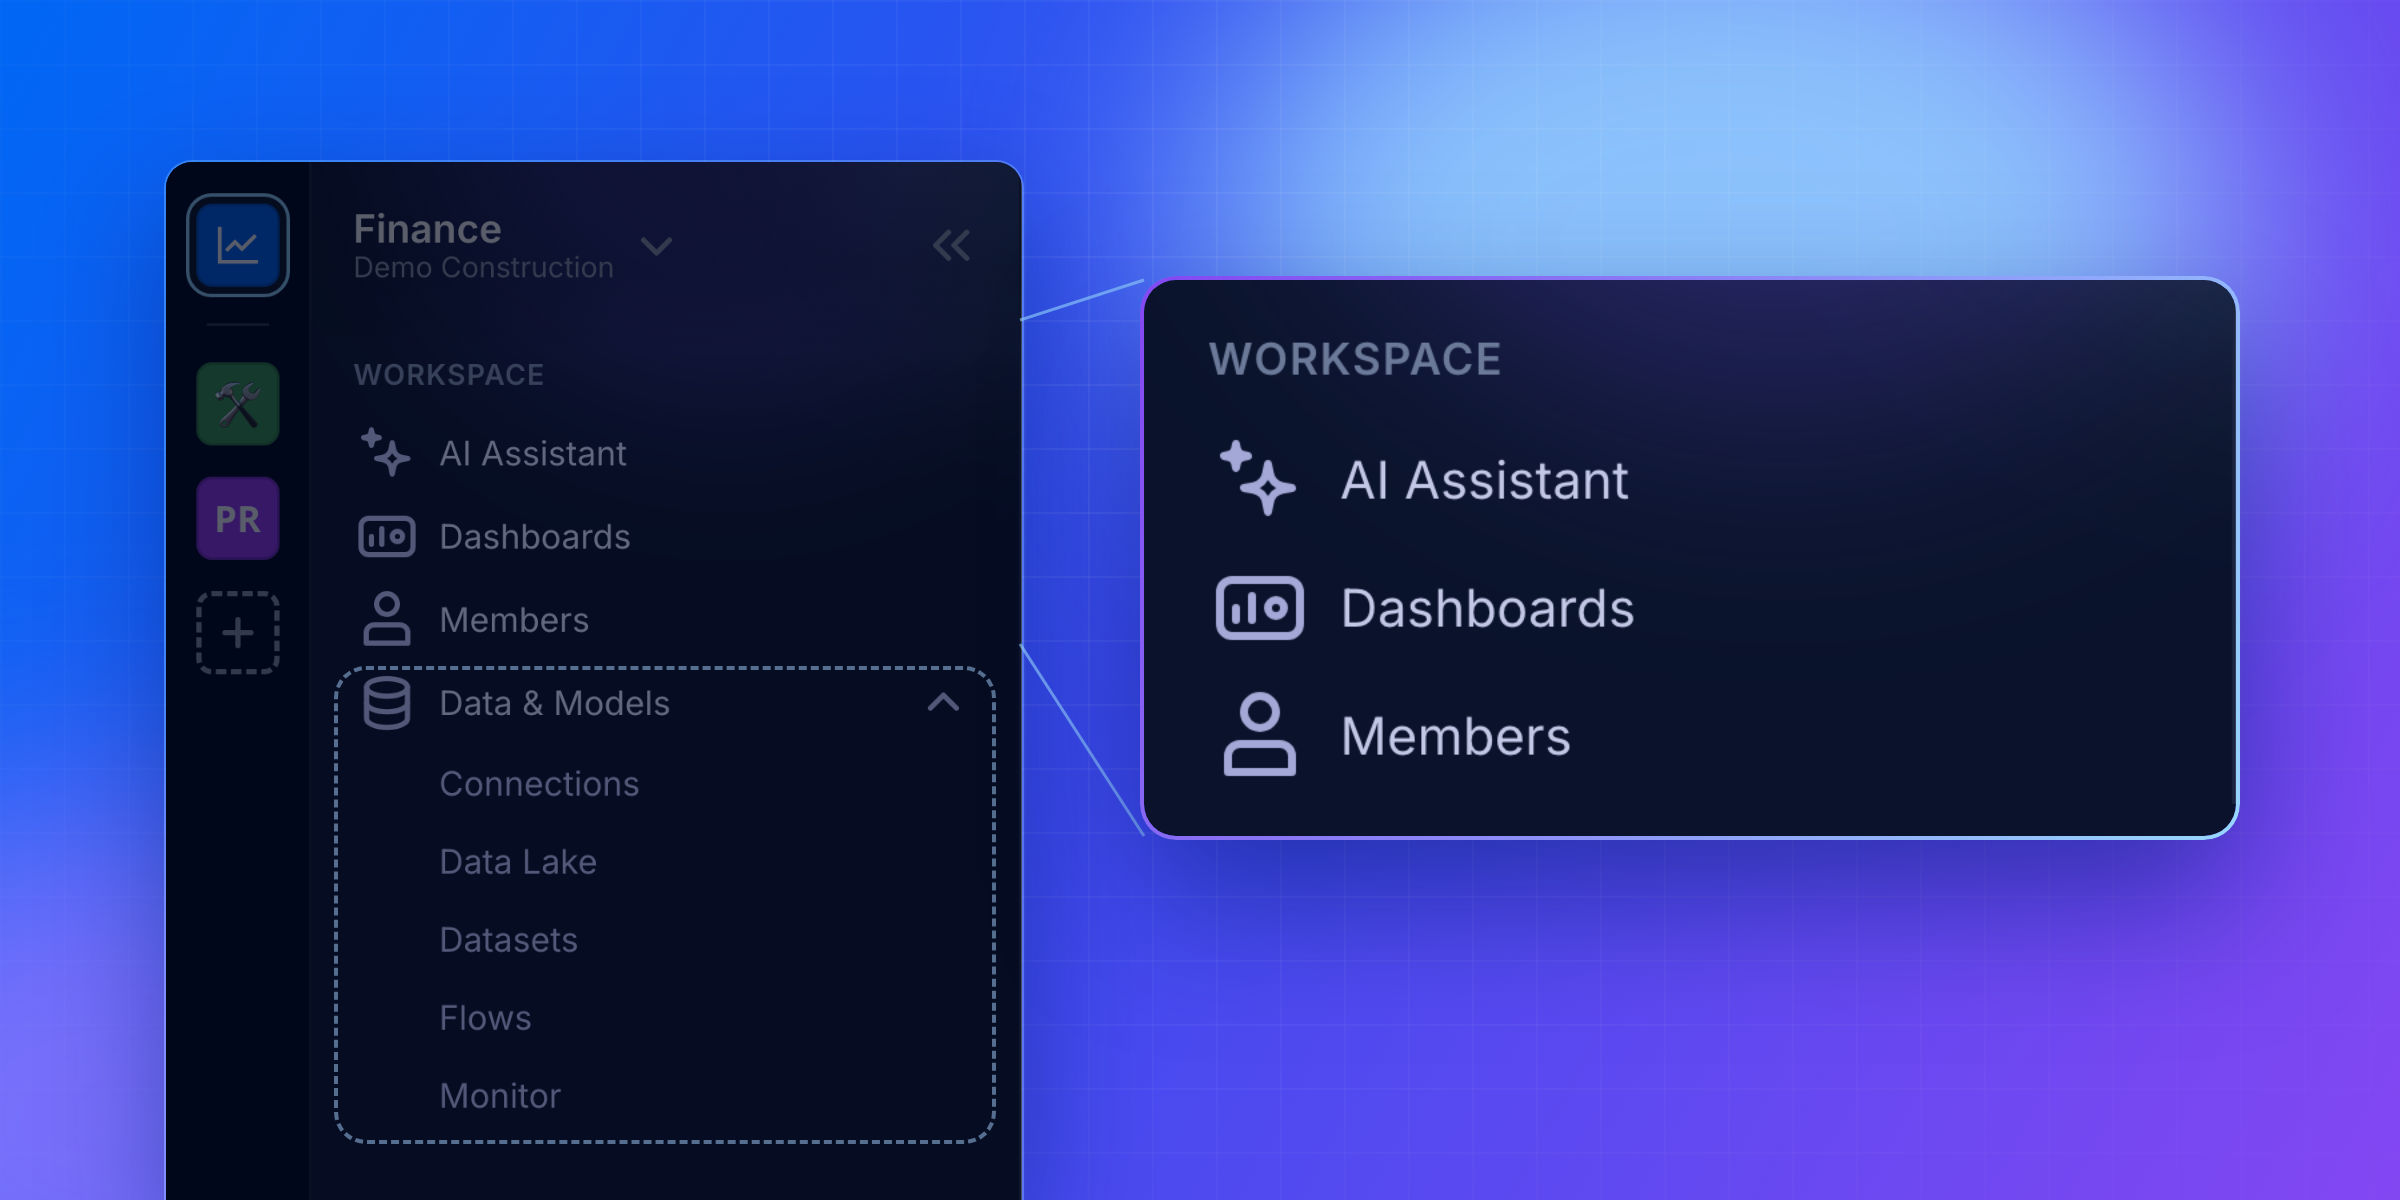
Think of the sidebar in three levels. Your organization holds your workspaces, the rail of tiles on the far left shows the ones you belong to, and the panel beside it lists the sections of the workspace you're in. Settings and your account sit at the bottom of the rail.
Why it matters
- Your daily work comes first. Under the WORKSPACE heading, AI Assistant and Dashboards lead, and the data tools sit together in the Data & Models group.
- See only what your role calls for. Viewers get the business layer, while Data & Models, Settings and Account appear for the editors and admins who build with data.
- Keep settings out of your way. Organization settings, Members, Connections and Account each have a screen of their own, so a link opens the one you need.
What you can do with the BEEM sidebar
Reach your everyday tools first
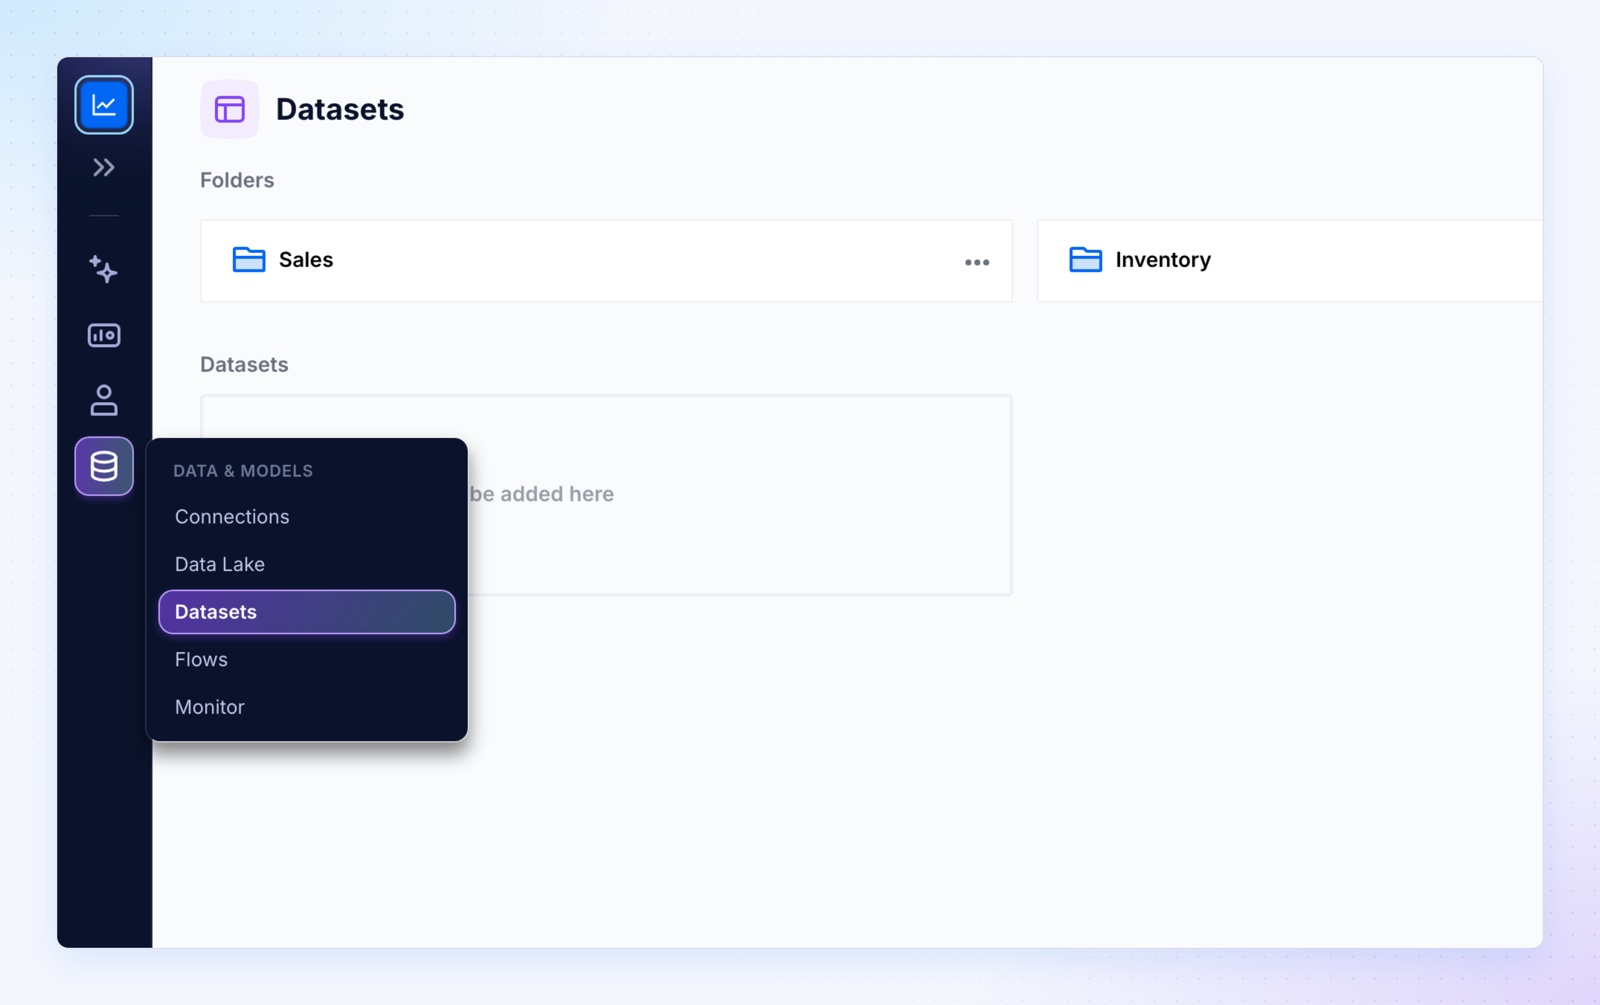
Under the WORKSPACE heading, AI Assistant and Dashboards come first, then Members for Org admins. The tools for building with data sit together in the Data & Models group, with Connections, Data Lake, Datasets, Flows and Monitor, and the group folds closed with a click on its header.
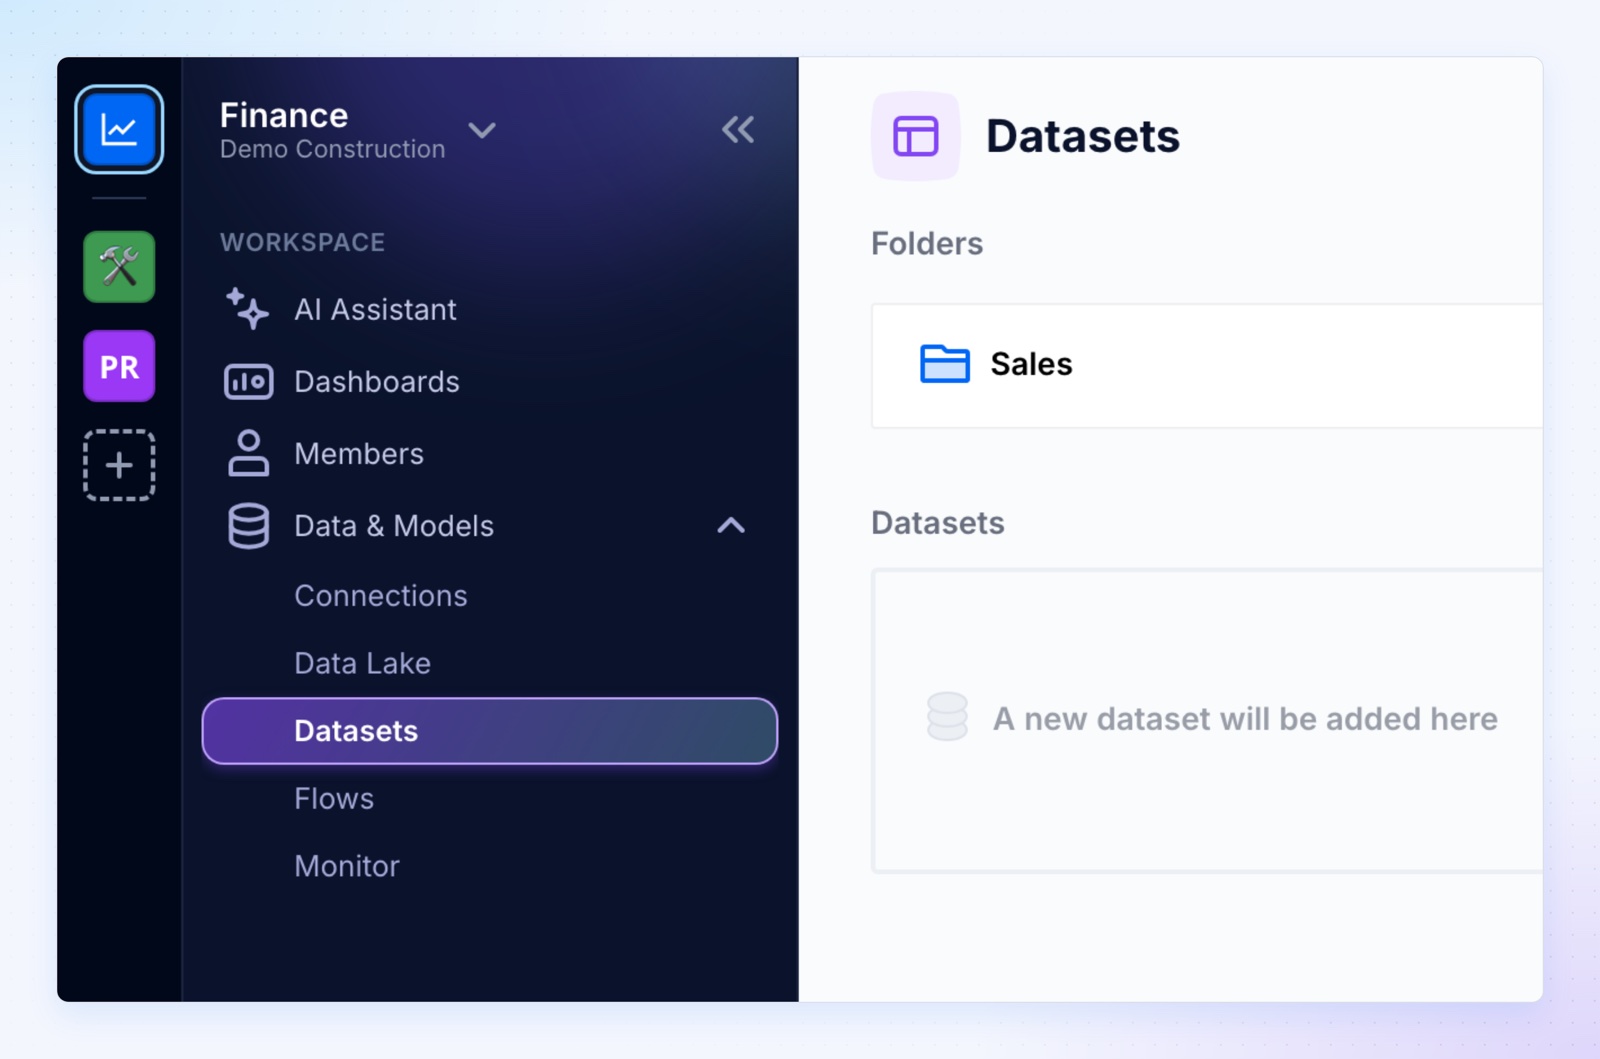
Open each setting on its own screen
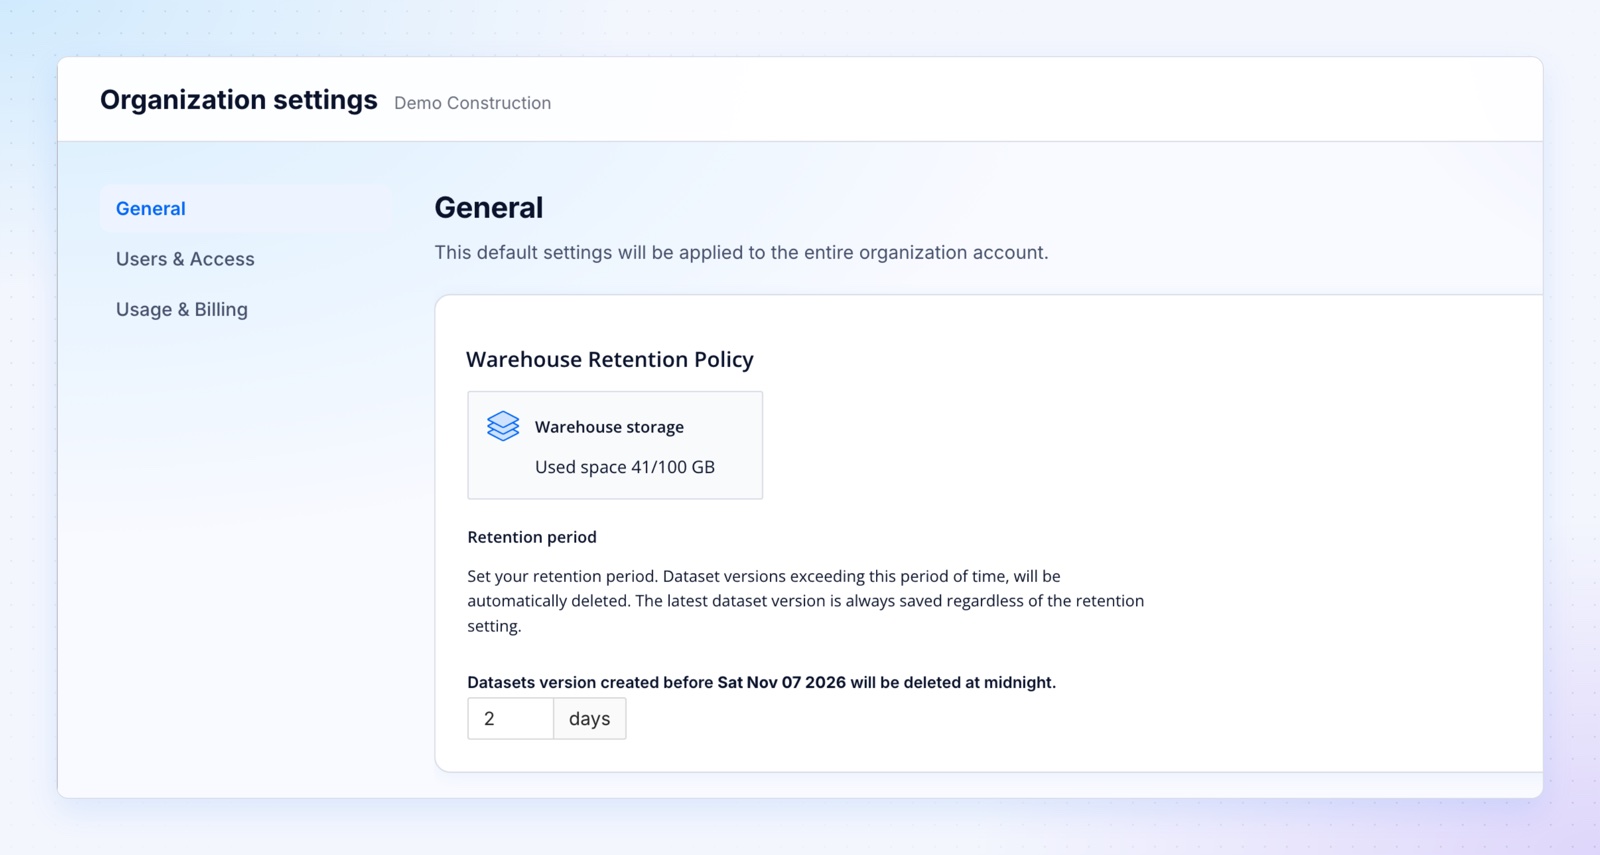
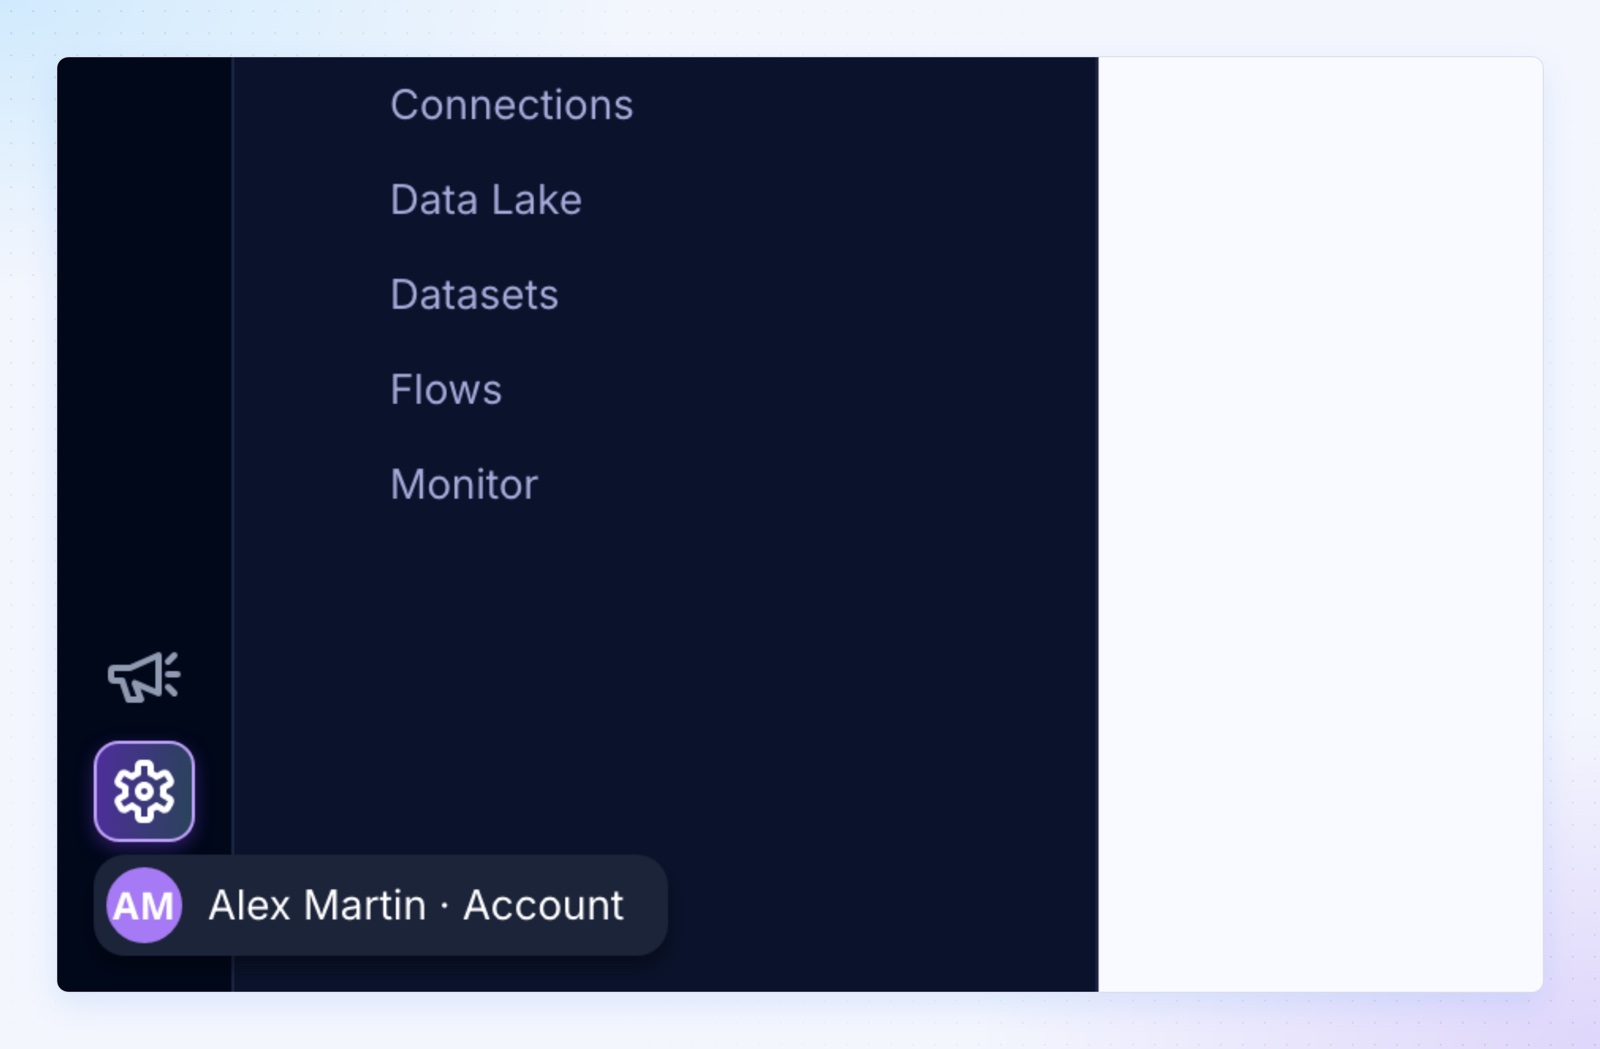
Click the gear icon at the bottom of the rail to open Organization settings, with General, Users & Access, and Usage & Billing tabs. Members and Connections each have a row of their own in the sidebar, with Connections inside the Data & Models group. Account, in your profile menu, holds your personal Credentials.
Find shared datasets next to your own
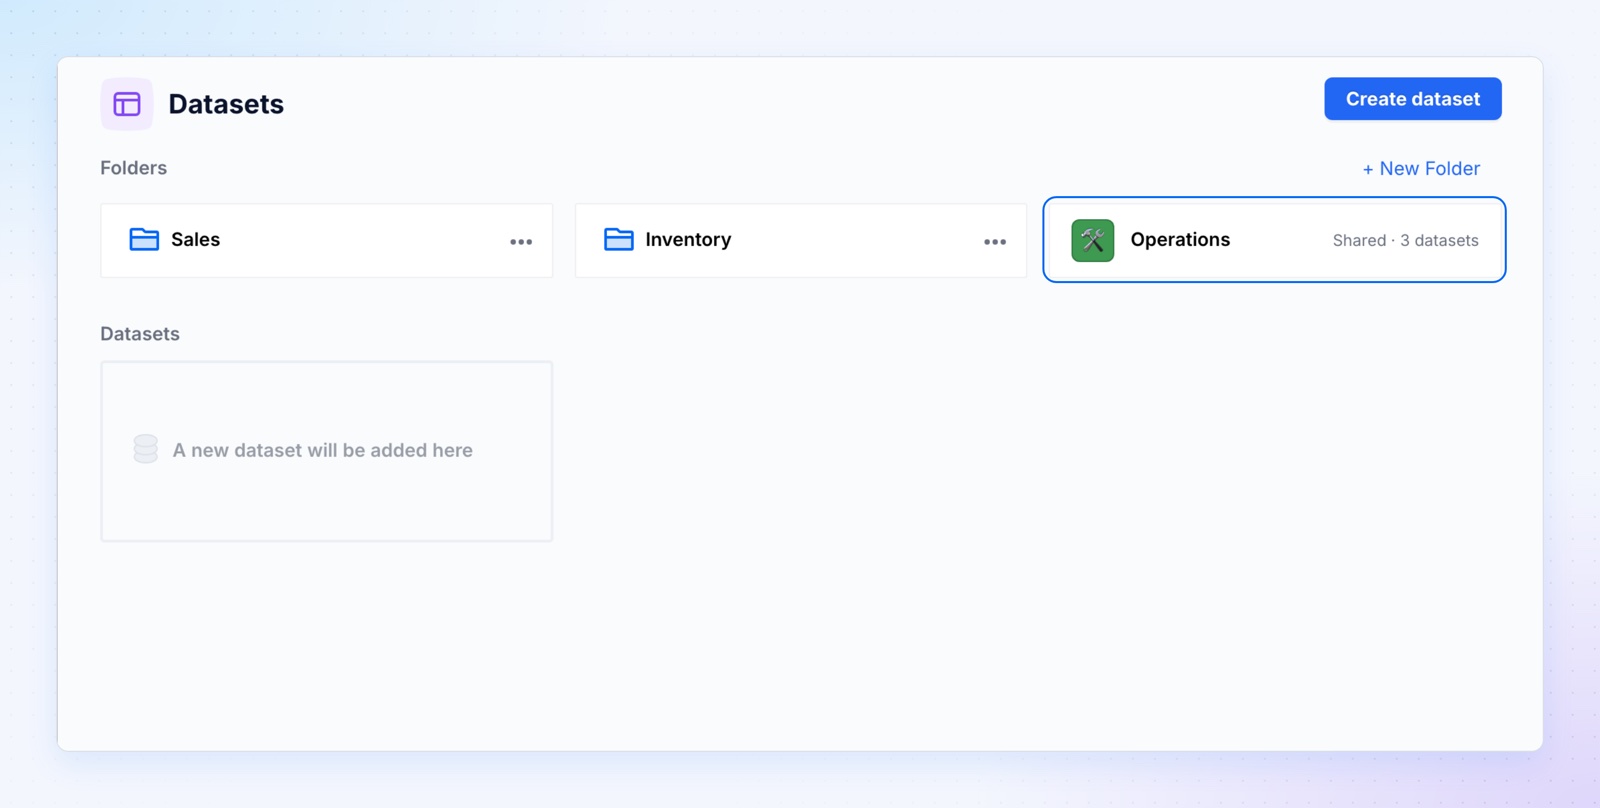
At the root of the Datasets page, after your own folders, each workspace that shares datasets with yours appears as a folder with its tile, its name and a count such as "Shared · 3 datasets". Open it to explore those datasets. They're read-only here and managed in the workspace that owns them.
Move between the workspaces you belong to
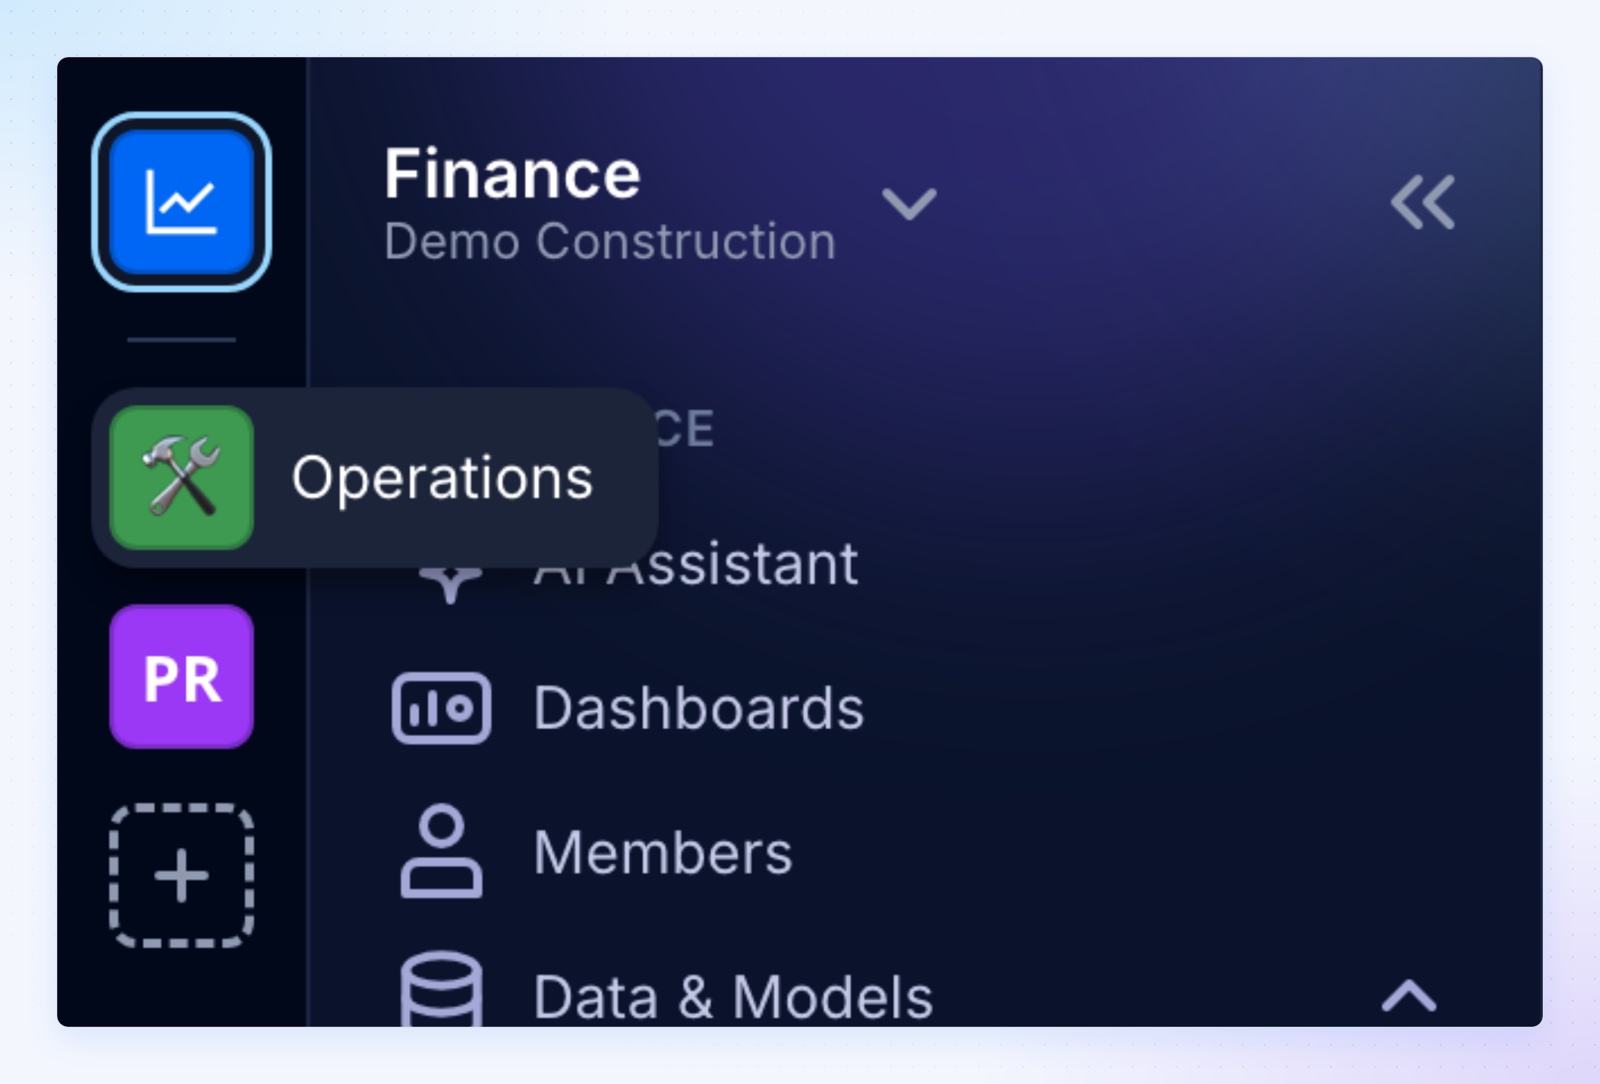
The rail holds the workspace level: a tile for each workspace you belong to in the current organization, with the current one ringed on top. Hover a tile to see its name, or click it to switch. If you belong to more than one organization, use "Switch organization…" in your account menu.
Make each workspace easy to recognize
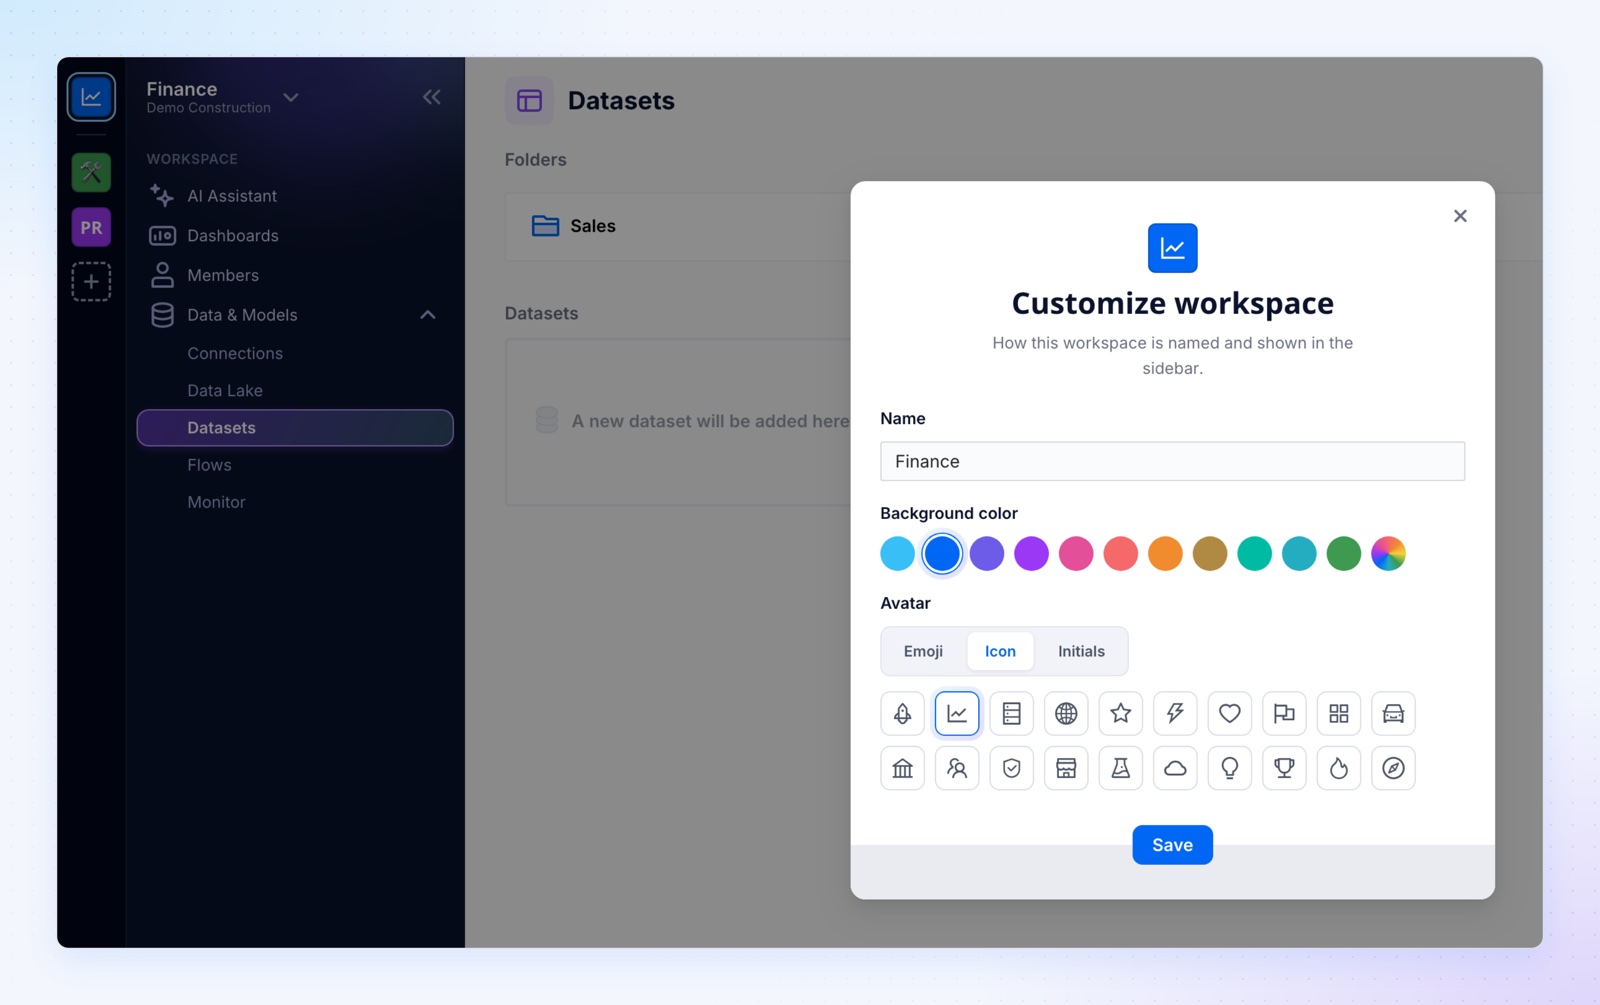
Org admins click the workspace name at the top of the sidebar and choose Customize to set its Name, Background color and Avatar. Pick one of 11 preset colors or a custom one, then one of 24 emoji, one of 20 icons, or Initials, with up to two letters such as "FN" to tell apart names that start alike. Org admins also create workspaces from the dashed + tile, setting the name and look in one dialog, and its hover label shows usage such as "Create workspace (3 of 5)". Everyone sees the chosen look on the rail, on shared folders and on share tags.
Give your work more room on screen
Collapse the sidebar to a narrow column of icons. Hover any icon to see its name, or open Data & Models as a flyout menu. Click "Expand sidebar" under your workspace's tile, or the tile itself, to bring it back.
Where to find it
Everything lives in the BEEM sidebar.
- Find AI Assistant and Dashboards under WORKSPACE, then open Data & Models for Datasets and the other data tools.
- Click the gear icon for Organization settings, or your profile button, then Account.
- Click the workspace name at the top, then Customize, or create a workspace with the dashed + on the rail.
Availability
- Everyone, viewers included, can use AI Assistant and Dashboards and switch between the workspaces they belong to in the current organization.
- Org admins and editors also get Data & Models, including shared folders, plus Settings and Account. Editors see Settings' General tab only.
- Org admins can also create and customize workspaces, open Members and Connections, and see Users & Access and Usage & Billing. BEEM sets each organization's workspace limit.
- The other workspaces' tiles are hidden while the sidebar is collapsed, so expand it to switch.